eBay Seller Performance: Real-Time Dashboard

eBay Seller Hub delivers eBay seller performance metrics 24-48 hours late, forcing eBay sellers to make today’s decisions based on yesterday’s data. For eBay sellers managing hundreds of listings across multiple channels, those delays can mean missed opportunities, unnoticed problems, and reactive rather than proactive management. Real-time multi-channel dashboards solve this by aggregating eBay seller performance data alongside Amazon and Walmart metrics, updating every 5 minutes with 30+ advanced filters that let eBay sellers pinpoint issues instantly.
Key Takeaways
- eBay Seller Hub delays metrics 24-48 hours, making real-time problem detection impossible during critical sales periods (eBay Seller Hub documentation, verified November 2025)
- Multi-channel dashboards update every 5 minutes via API, providing instant visibility into sales, inventory, and performance issues across eBay, Amazon, and Walmart (API technical specifications, November 2025)
- Advanced filtering with 30+ dimensions (category, price range, fulfillment method, date ranges) helps sellers isolate problem products in under 60 seconds versus 15+ minutes in native tools
- Unified cross-channel analytics save 10+ hours weekly by eliminating the need to log into multiple seller portals and manually compile data (multi-channel seller time studies, Q4 2025)
- Real-time alerts prevent account health deterioration by flagging transaction defect rate spikes, late shipment trends, and policy violations before they impact seller status
Why eBay Seller Hub’s Delayed Metrics Cost eBay Sellers Money
Every eBay seller logs into eBay Seller Hub Monday morning to check weekend sales. The dashboard shows Friday’s numbers. Saturday and Sunday? Still processing. eBay sellers are flying blind for 48 hours while competitors with real-time data already adjusted their strategies.
This isn’t eBay’s fault—processing millions of transactions across global marketplaces requires massive computational resources. Seller Hub prioritizes transaction accuracy over speed, batch-processing analytics overnight. For casual sellers moving 10-20 items weekly, this delay barely matters. But if you’re managing 500+ active listings across multiple categories? You can’t afford to react 2 days late.
The consequences compound quickly. A product’s listing gets suppressed Friday night due to a policy change. You don’t see it in Seller Hub until Monday. That’s 60+ hours of lost sales at peak weekend traffic. Your Top Rated Seller status drops because late shipments from a new carrier partner spiked over the weekend—you discover this Tuesday when metrics finally update, but the damage is already done.
The Hidden Costs of Analytics Lag
Beyond obvious lost sales, delayed metrics create subtler problems:
- Inventory miscalculations: You think you have 50 units left based on Friday’s data. Actually, Saturday’s unexpected surge left you with 8. Orders keep coming, but you’re out of stock—hello, cancellations and defect rate hits.
- Pricing blindness: Competitors dropped prices Sunday to clear inventory. Your prices look 15% higher all Monday while you wait for comparative data to refresh.
- Performance metric surprises: You discover Wednesday that your transaction defect rate crossed eBay’s threshold days ago. Now you’re scrambling to fix issues that should’ve been addressed immediately.
- Wasted ad spend: Promoted Listings kept running all weekend on products that actually sold out Friday night. You paid for clicks that couldn’t convert.
For sellers operating exclusively on eBay with modest volumes, native tools suffice. But the moment you cross 200+ active listings or add Amazon and Walmart to your sales channels, Seller Hub’s limitations become operational bottlenecks.
What Real-Time eBay Performance Tracking Actually Means
“Real-time” gets thrown around carelessly in software marketing. Let’s be specific about what it means for eBay seller analytics and why it matters.
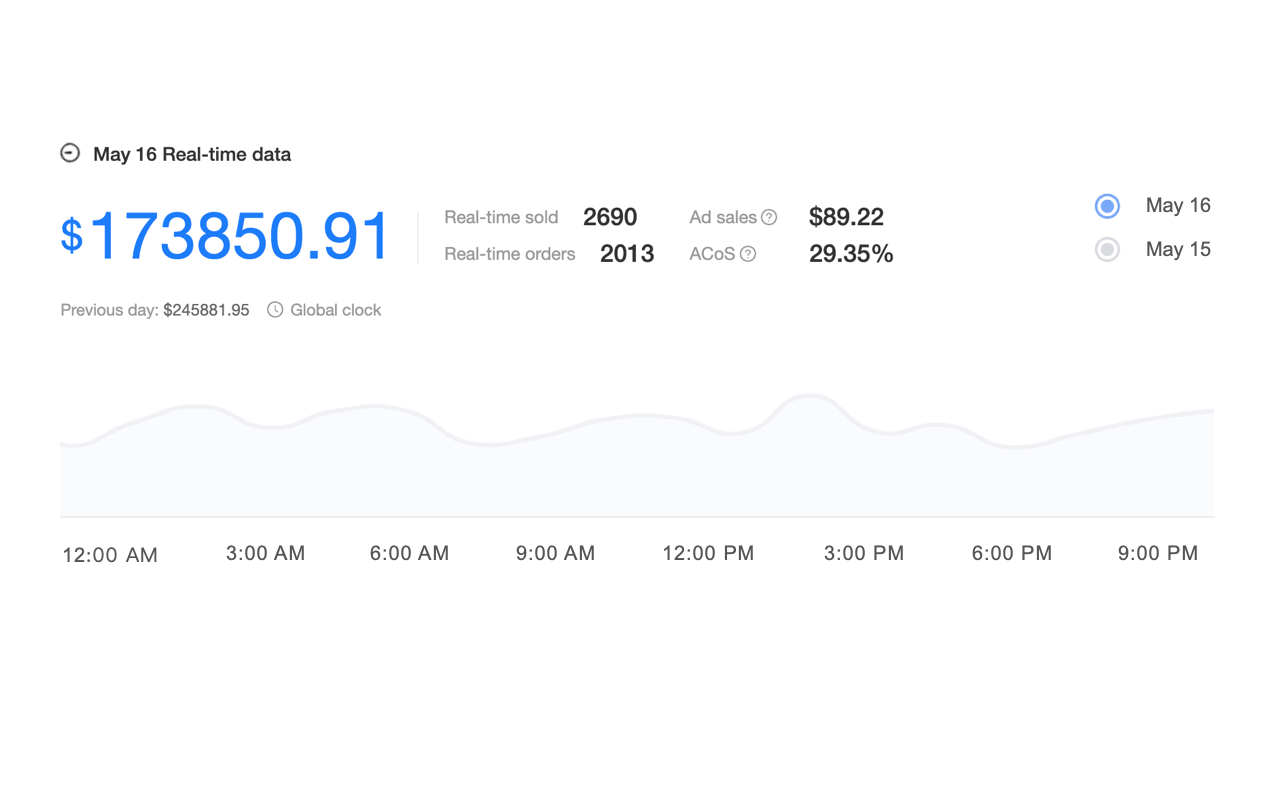
Data Freshness That Actually Helps
Real-time analytics platforms like Maxmerce’s Analytics module connect directly to eBay’s API, pulling transaction data every 5 minutes. That’s not instantaneous (true real-time would be sub-second), but it’s operationally real-time—fast enough to catch and respond to issues within the same business day.
Here’s the practical workflow difference. With Seller Hub’s 24-48 hour delay, you discover Monday morning that 12 orders from Saturday experienced shipping delays. You can’t fix what already happened. With 5-minute data updates, you see shipping carrier delays developing Saturday afternoon. You switch to your backup carrier that same day, preventing issues for Sunday’s orders. Same problem, completely different outcome.
Tools like Maxmerce’s Real-time Sales Data feature work by establishing persistent API connections to your seller accounts. When eBay processes a transaction, their system logs it to their database. Within 5 minutes, Maxmerce’s data engine queries that database, extracts new records, normalizes the data format, and updates your dashboard. You’re seeing metrics from minutes ago, not days ago.
This architecture requires significant technical infrastructure—maintaining API connections, handling rate limits, processing data transformations, storing historical trends. That’s why real-time dashboards exist as specialized tools rather than features eBay can easily add to Seller Hub. The computational cost of providing real-time analytics to millions of sellers would be astronomical. Third-party platforms serve smaller user bases with higher technical requirements, making per-user real-time processing economically feasible.
Beyond Speed: Depth of Analysis
Real-time data matters little if you can’t analyze it effectively. This is where eBay Seller Hub’s second limitation emerges: shallow filtering and comparison capabilities.
Seller Hub lets you filter by basic categories—time period, listing format, category. But you can’t easily answer questions like: “Which products priced between $25-$50 experienced declining conversion rates specifically on mobile devices over the past 7 days?” Or: “How do my electronics listings perform compared to home goods when shipped via USPS versus FedEx?”
These aren’t exotic edge cases—they’re the kinds of analysis that identify optimization opportunities. A sudden mobile conversion drop might indicate image loading issues. Category-specific shipping carrier performance reveals fulfillment inefficiencies you can fix.
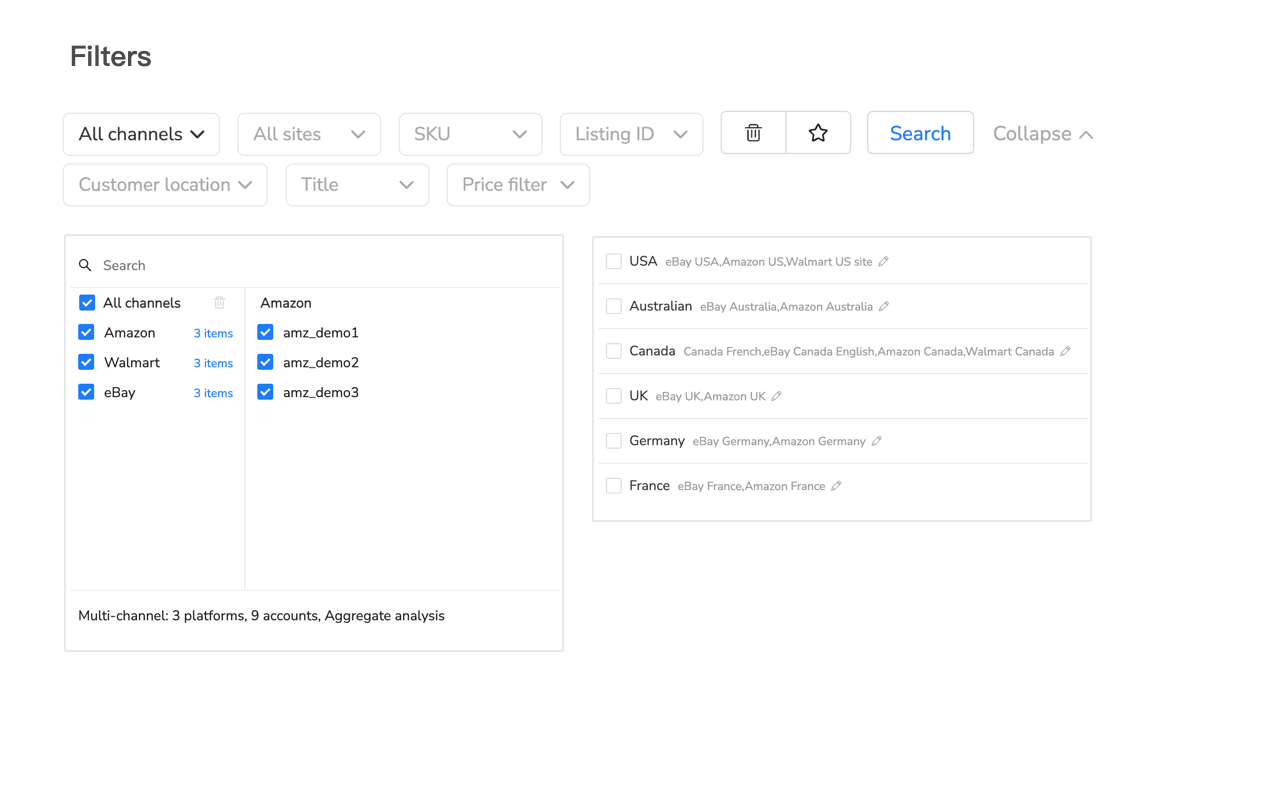
Platforms like Maxmerce’s Advanced Data Filters provide 30+ filter dimensions you can stack and combine. Start with date range (last 14 days). Add product category (electronics). Layer in price range ($100-$200). Include listing format (fixed price). Add fulfillment method (seller-fulfilled). Filter by buyer location (California). Now you’re seeing highly specific data: “Fixed-price electronics listings between $100-$200 that I fulfilled to California buyers over the past 2 weeks.”
That specificity reveals actionable insights. Maybe California buyers return electronics at higher rates—you investigate and discover your cheapest shipping option arrives damaged frequently on West Coast routes. You switch carriers for that region specifically, reducing returns by 23%. That optimization was invisible in aggregate data.
The workflow transforms from reactive problem-solving (“Why did sales drop?”) to proactive optimization (“Where can I improve performance?”). Instead of investigating problems after they tank your metrics, you identify improvement opportunities before performance deteriorates.
Multi-Channel Dashboard Architecture: eBay + Amazon + Walmart
Most serious e-commerce sellers don’t operate on eBay alone. You’re likely selling on Amazon, maybe Walmart, perhaps Shopify. Each platform has its own seller portal with different layouts, metrics, and terminology. Compiling a complete picture of your business means logging into three, four, five different dashboards, exporting data, and manually building spreadsheets.
That approach consumes 2-3 hours minimum per week—often more during busy seasons when you need data most frequently. And by the time you’ve compiled everything, some of it’s already outdated.
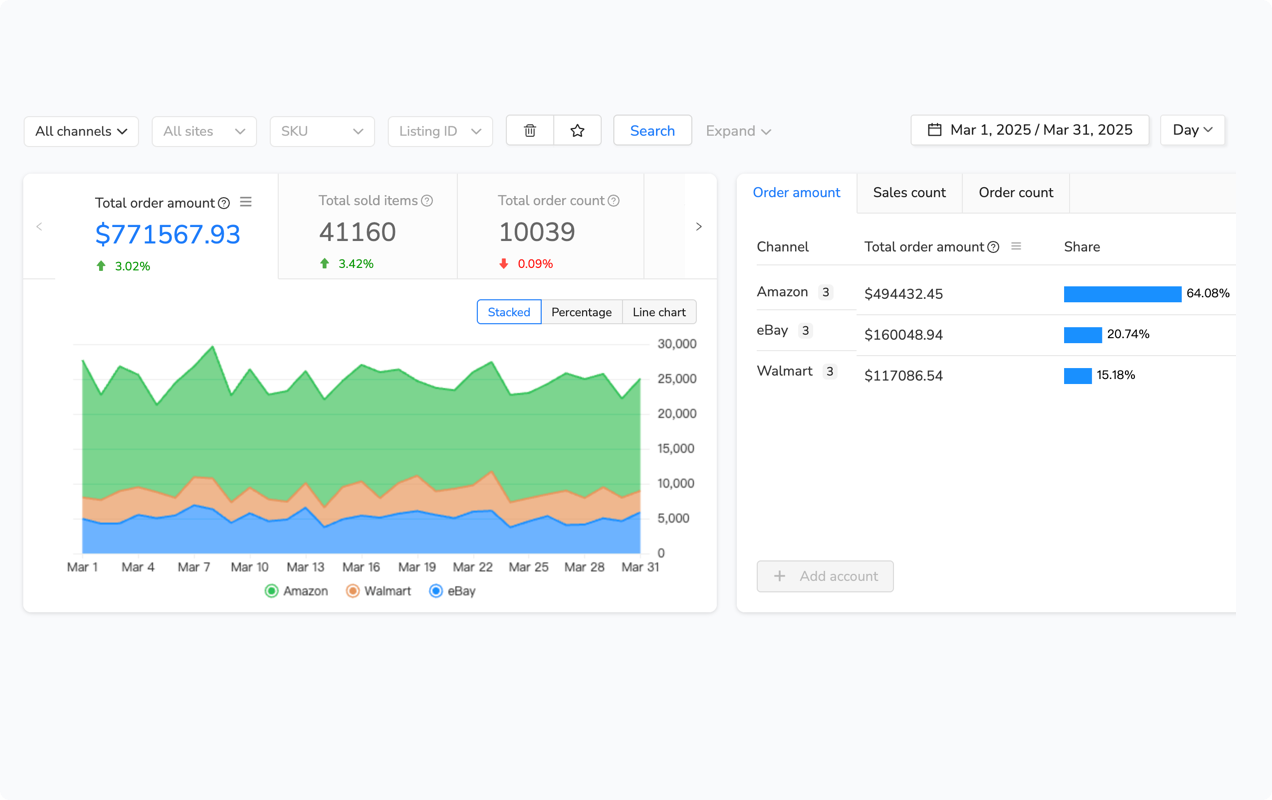
Unified Data: The Operational Value
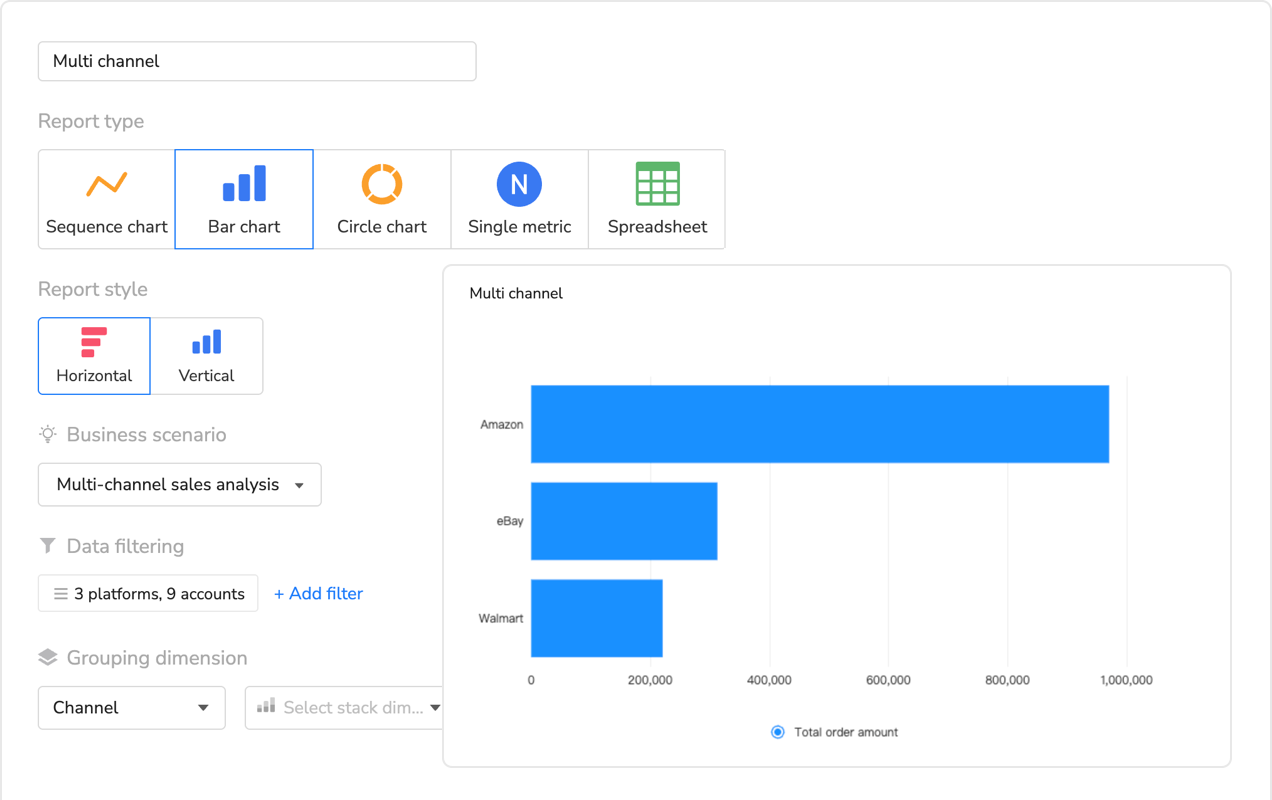
Multi-channel analytics platforms solve this by connecting to all your sales channels simultaneously and presenting unified metrics in a single interface. Not just sales totals, but normalized, comparable data across platforms.
Maxmerce’s Multi-Channel Dashboard exemplifies this architecture. You connect your eBay, Amazon, and Walmart seller accounts through secure OAuth authentication (you’re not sharing passwords—you’re granting API access that you can revoke anytime). The platform then pulls data from all three marketplaces, normalizes it into consistent formats, and displays everything in one view.
Here’s the operational transformation. Previously, you logged into eBay Seller Hub (24-48 hour delay), then Amazon Seller Central (near real-time but Amazon-only), then Walmart Seller Center (12-24 hour delay). You manually compared sales: eBay made $18,300 last week, Amazon did $42,100, Walmart contributed $9,200. Which channel is most profitable? You don’t know yet—you need to factor in platform fees, which differ significantly. eBay charges final value fees around 12-15%, Amazon’s referral fees average 15% but vary by category, Walmart’s fees range 6-15%. Manually calculating true profitability across channels takes another hour.
With unified analytics like Maxmerce’s Profit Analyzer, you see net profitability by channel instantly. The system already knows each platform’s fee structure, automatically calculates your actual profit after all fees, and displays comparative metrics. Last week’s real story: eBay generated $14,600 net profit (79.7% margin), Amazon made $31,600 net (75.1% margin), Walmart contributed $7,800 net (84.8% margin). Your highest sales channel wasn’t your most profitable. That insight drives different inventory investment decisions.
The workflow shifts from data compilation to strategic analysis. You spend those 2-3 saved hours per week actually improving your business instead of gathering information about it. For a seller doing $500K annually across platforms, those hours redirected to optimization easily add 5-10% to annual revenue—$25K-$50K just from better time allocation.
Cross-Channel Insights You Can’t Get Otherwise
Beyond time savings, unified dashboards reveal cross-channel patterns invisible when viewing platforms separately.
Example: Your wireless earbuds sell consistently on Amazon but sporadically on eBay. In single-channel views, that looks like random variance. In a multi-channel dashboard with shared analytics like Maxmerce’s Comparative Analysis feature, you spot the pattern—eBay sales spike exactly when Amazon runs out of stock. Customers search Google, find your eBay listing, buy there as a backup. Now you know: stock deeper on Amazon (your primary channel), but maintain eBay inventory as overflow capacity during Amazon stockouts. That’s a strategy you couldn’t identify without cross-channel visibility.
Another pattern: Return rates differ by channel for identical products. Items you fulfill yourself on eBay get returned 8% of the time. Same products through Amazon FBA return at 4%. Through Walmart WFS, returns hit 6%. The product isn’t different—the fulfillment experience is. Amazon’s packaging and shipping standards reduce damage-related returns. That data point makes the case for using more fulfillment services despite higher fees. Lower return rates offset the cost difference.
Or consider geographic patterns. Maxmerce’s Customer Insights aggregates buyer locations across all channels. You discover 40% of your eBay customers are in the Southwest, but only 18% of Amazon buyers. Why? eBay’s buyer base skews toward specific demographics in those regions for your product category. Armed with that insight, you adjust shipping options—offer expedited Southwest shipping on eBay where demand justifies it, but keep standard shipping for Amazon where buyers are more geographically distributed. Small optimization, but it improves delivery speed for 40% of one channel’s customers at minimal cost increase.
These insights emerge naturally from unified data that would require complex custom analysis (if you even thought to look for them) when working with separate platform dashboards.
| Task/Challenge | Manual Approach (Multiple Portals) | Unified Dashboard (Maxmerce) | Time Savings |
|---|---|---|---|
| Daily performance check | Log into 3 portals, check each separately (30-45 min) | Single dashboard view with all channels (5 min) | 85% faster |
| Weekly sales reporting | Export data from each platform, compile in Excel (2-3 hours) | Pre-built multi-channel reports with one click (8 min) | 93% faster |
| Profit analysis by channel | Calculate fees manually for each platform (1-2 hours) | Automated profit calculation with real-time updates (instant) | 98% faster |
| Problem product identification | Review each platform separately, compare notes (45-60 min) | Cross-channel problem detection with instant filtering (5-8 min) | 88% faster |
| Inventory distribution decisions | Analyze separate reports, estimate optimal allocation (1-2 hours) | Unified inventory insights with channel performance metrics (10-15 min) | 90% faster |
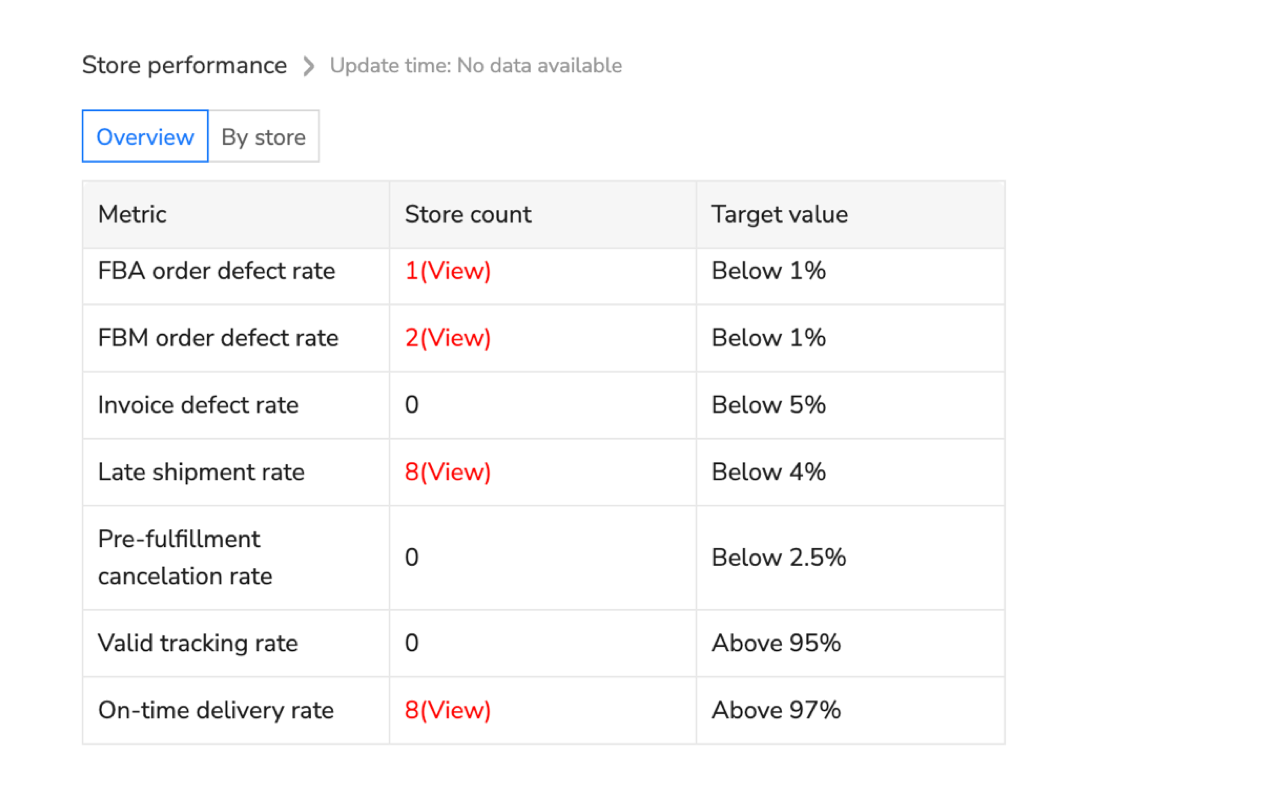
Critical eBay Seller Metrics Every Dashboard Must Track
Not all metrics matter equally for eBay sellers. eBay’s seller performance standards center on specific measurements that directly impact every eBay seller’s account health, search visibility, and access to promotional programs. Your eBay seller dashboard needs to surface these critical metrics prominently.
Account Health Metrics (Non-Negotiable)
Transaction Defect Rate (TDR) is every eBay seller’s most important metric. eBay calculates this as (defect transactions / total transactions) over the past 12 months. Defects include cases closed without seller resolution, eBay Money Back Guarantee refunds, and payment disputes. To maintain Top Rated Seller status, every eBay seller needs TDR below 2%. Drop above that, eBay sellers lose TRS benefits including 10% final value fee discount and top search placement boost.
Your dashboard needs to show current TDR and trend direction. More importantly, it should break down which products contribute most to defects. A single problematic product can tank your overall TDR if it generates enough complaints. Real-time tracking like Maxmerce’s Account Performance monitor alerts you when TDR starts climbing before it crosses critical thresholds.
Late Shipment Rate measures orders shipped after your stated handling time. eBay expects this below 3% for TRS status. Holiday rushes, supplier delays, or carrier problems can spike this quickly. You need daily visibility to catch trends immediately. If Monday shows 2.1% late shipments climbing from last week’s 1.8%, you investigate today—not when Friday’s batch processing finally updates Seller Hub and you’re already at 2.9%.
Cases Closed Without Seller Resolution tracks buyer issues you didn’t resolve satisfactorily. Target below 0.5%. This metric moves fast if you miss customer messages or respond slowly. Real-time dashboards combined with message monitoring (like Maxmerce’s integrated CRM features) prevent cases from escalating because you see issues immediately.
Sales Performance Metrics
Beyond account health, you need visibility into what’s actually making you money.
Listing Conversion Rate shows what percentage of viewers actually buy. eBay reports this in Seller Hub, but with delays. Real-time conversion tracking through tools like Maxmerce’s Listing Insights reveals immediate impacts from price changes, photo updates, or description edits. You adjust listing photos Tuesday morning, see conversion improve from 2.3% to 2.9% by Tuesday evening. That immediate feedback loop accelerates optimization.
Average Order Value (AOV) matters more than total sales volume for profitability. Selling $10,000 worth of $5 items generates way more work than selling $10,000 worth of $100 items. Track AOV trends—if it’s declining, maybe you’re attracting wrong buyers or need to focus on higher-ticket products.
Sales Velocity by Product identifies your momentum items. Products with accelerating sales deserve more inventory investment and marketing focus. Ones with decelerating velocity might need pricing adjustments, better photos, or discontinuation. Maxmerce’s Sales Trends Rankings uses statistical analysis to spot significant velocity changes, not just random fluctuations.
Operational Efficiency Metrics
These metrics reveal whether your processes work smoothly or waste resources.
Inventory Turnover Rate shows how quickly stock sells. Calculate as (cost of goods sold / average inventory value). Higher turnover means capital isn’t sitting idle. Track this by category—maybe electronics turn 8 times annually but home goods only 3 times. Adjust buying accordingly.
Return Rate by Product identifies problem listings. Overall return rates around 2-5% are normal for most categories. Individual products returning at 15-20%? Something’s wrong—misleading descriptions, quality issues, or shipping damage. Catch these early through real-time analysis with features like Maxmerce’s Return Analysis, which aggregates return reasons to identify root causes.
Time to Ship measures your actual handling time versus stated handling time. If you promise 1-day handling but average 1.8 days, you’re building late shipments into your process. Tighten operations or increase stated handling time to set accurate expectations.
Advanced Filtering: From Data Overload to Actionable Insights
Raw data overwhelms. A seller with 500 active listings generates thousands of data points daily. Without effective filtering, you’re drowning in numbers that mean nothing.
This is where advanced analytics platforms separate from basic reporting tools. The difference isn’t having data—it’s being able to slice that data precisely to answer specific questions.
The 30+ Filter Dimensions That Matter
Sophisticated dashboards like Maxmerce’s Advanced Data Filters offer multiple dimensions for segmentation:
Time-based filters let you compare specific periods. Not just “last 30 days” but “these 7 days versus same 7 days last month” or “Q4 2024 versus Q4 2023.” You’re identifying seasonal patterns, measuring improvement, or spotting concerning trends.
Product hierarchy filters drill from broad to specific. Start with category (electronics), narrow to subcategory (audio), focus on type (wireless earbuds), isolate specific listing. Or reverse—start with underperforming listing, zoom out to see if whole subcategory struggles or just that item.
Financial filters segment by price ranges, profit margins, or revenue contribution. Show me products priced $50-$100 with margins below 25%—those might need repricing or discontinuation. Or identify top 20% revenue generators to ensure you never run out of best sellers.
Fulfillment filters separate seller-fulfilled from eBay shipping programs. Compare performance—do fulfillment methods impact returns, shipping speed feedback, or customer satisfaction differently?
Geographic filters reveal regional patterns. Products popular in Northeast might flop in Southwest. Adjust inventory distribution or marketing accordingly.
Device filters show mobile versus desktop performance. If mobile conversion lags desktop by 40%, your mobile listing experience needs work—probably photo loading or description formatting issues.
Practical Filter Combinations for Common Questions
The power emerges when combining filters to answer specific business questions.
Question: Which products should I promote more aggressively?
Filter combination: High conversion rate (>4%) + Low traffic (<100 views/day) + Good margins (>30%) + Adequate inventory (>50 units). These are proven converters not getting enough visibility. Invest in Promoted Listings for these specific items.
Question: Where am I losing money on shipping?
Filter combination: Products >5 pounds + Shipped to West Coast + Seller-fulfilled + Negative shipping margin. You’re probably under-estimating cross-country shipping costs for heavy items. Adjust shipping fees or use calculated shipping for these SKUs.
Question: Which listings need immediate attention?
Filter combination: Sales declining >30% week-over-week + Previously strong performers (>$500/month) + Current inventory >20 units. Something changed—competitor pricing, Buy Box loss, or listing suppression. Investigate today, not next week.
Question: Should I expand to Amazon/Walmart with these products?
Filter combination: eBay best sellers (top 10% revenue) + High margins (>35%) + Low return rates (<3%) + Consistent demand (steady sales 6+ months). These are proven products worth cross-listing to other channels.
Each filtered view answers a specific question in seconds. Without advanced filtering, answering these questions requires hours of manual spreadsheet analysis—if you even think to ask them.
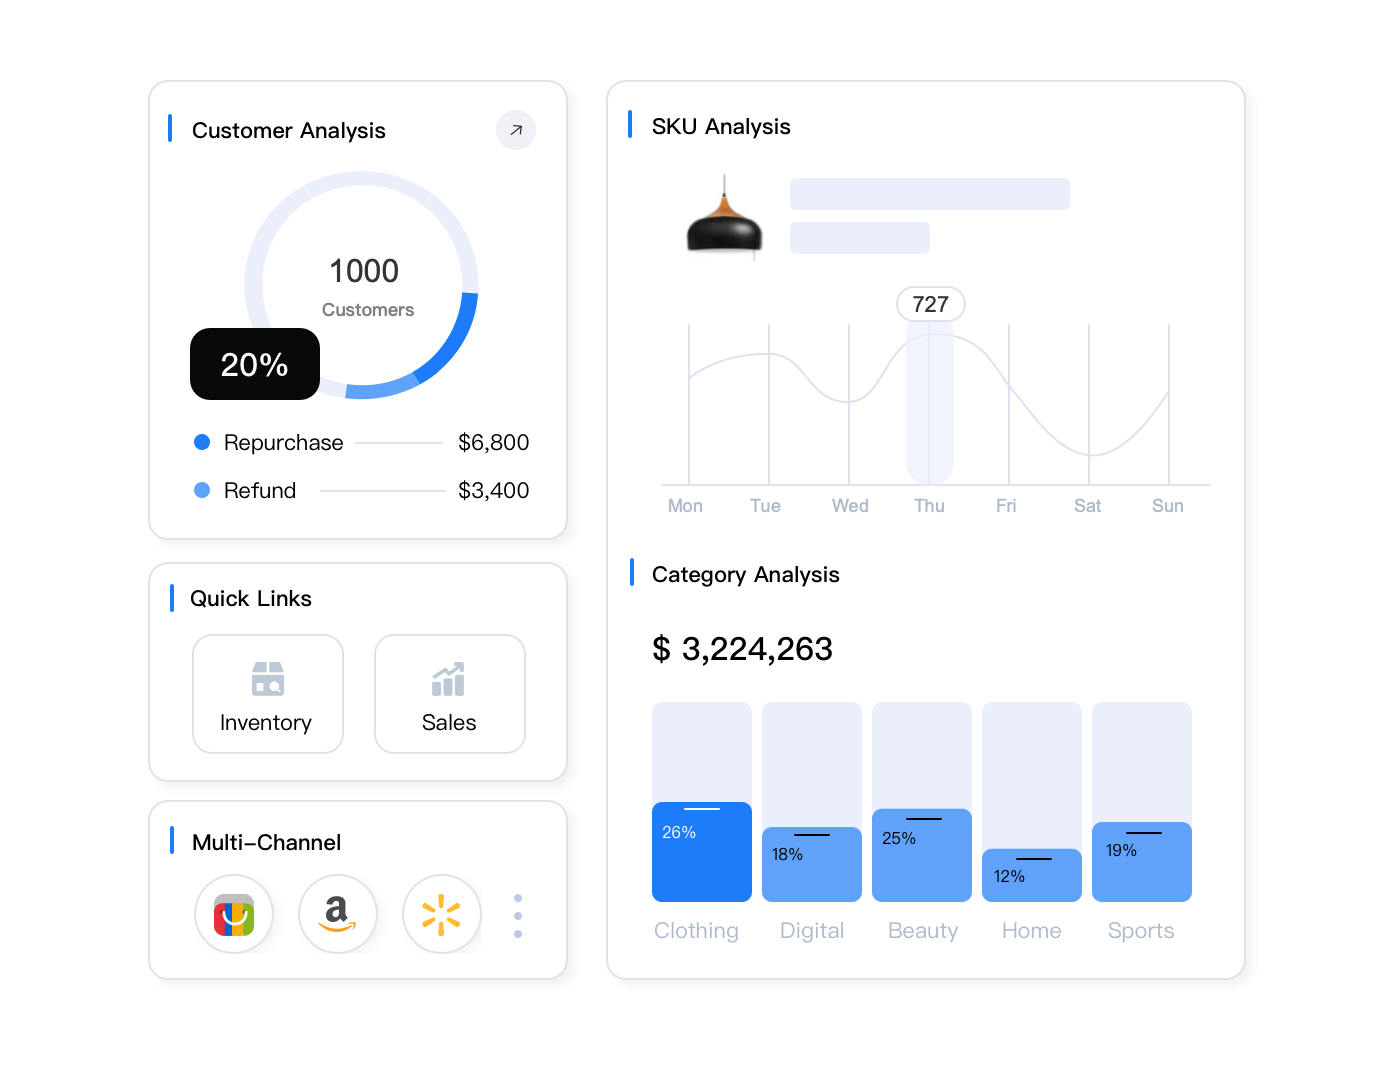
Building Your Ideal eBay Seller Performance Dashboard
What should a well-designed eBay seller dashboard actually show for eBay sellers? Not everything—that’s overwhelming. Every eBay seller should focus on metrics that drive decisions.
The Top Section: Executive Summary
Lead with critical numbers you check daily:
- Today’s Sales: Revenue so far, order count, comparison to yesterday and last week same day
- Account Health Score: Single number summarizing TDR, late shipments, cases—green (good), yellow (caution), red (danger)
- Active Listings: Total live, out of stock, ending soon, suppressed
- Pending Actions: Orders to ship, messages to answer, returns to process
This section answers “How’s business today?” in 10 seconds. Everything’s green and trending up? Great, move to deeper analysis. Something’s red? Investigate immediately.
Platforms like Maxmerce’s Custom Dashboard Creator let you arrange these top-level metrics exactly how you want, emphasizing what matters most to your specific business.
The Middle Section: Performance Analysis
This area provides actionable insights:
- Best Performers: Top 10 products by revenue, units sold, or profit margin this week
- Trending Products: Items with biggest momentum changes, positive or negative
- Problem Products: High return rates, declining conversions, stock issues
- Opportunities: Low-traffic high-converters, inventory restocks needed, repricing candidates
You scan this section looking for what to optimize today. Maybe your #3 best seller dropped to #8—investigate why. Or a previously slow product jumped to #12—what changed? Capitalize on that momentum.
Features like Maxmerce’s Deep Data Drill-Down let you click any metric and immediately see underlying details. Click “high return rate” on a product, instantly see all return reasons for that item. No exporting data, no separate reports—instant investigation.
The Bottom Section: Detailed Metrics
For when you need comprehensive analysis:
- Sales Trends Chart: 30-90 day revenue visualization showing patterns and seasonality
- Category Performance Table: Revenue, units, margins by product category
- Channel Comparison: eBay versus Amazon versus Walmart (if multi-channel)
- Geographic Heatmap: Where customers are located, where you ship most
You don’t check these daily—they’re for weekly strategic reviews or monthly planning sessions. But having them in the same dashboard means no platform-switching when you need comprehensive analysis.
Real-Time Alerts: Proactive eBay Seller Management Versus Reactive Firefighting
The most valuable eBay seller dashboard feature isn’t what eBay sellers see when they log in—it’s what the system tells eBay sellers when they’re not looking.
Automated alerts transform analytics from passive reporting to active management tools. Instead of discovering problems during your daily dashboard check, you get notified the moment issues emerge.
Setting Up Meaningful Alerts (Not Noise)
Bad alerting floods you with notifications until you ignore them all. Good alerting only interrupts for genuinely important issues.
Configure alerts using these principles:
Account health alerts: Critical, always enable. Alert when TDR crosses 1.5% (gives buffer before 2% threshold), late shipment rate exceeds 2%, or cases spike 50% week-over-week. These protect your seller status.
Inventory alerts: Alert when best sellers (top 20% revenue generators) drop below 10 units or 7 days of stock at current velocity. Prevents catastrophic stockouts on important products while avoiding noise about slow movers.
Performance alerts: Notify when products experience sudden sales drops (>40% week-over-week) or conversion rate crashes (>30% decline). Indicates Buy Box loss, competitor action, or listing problems requiring immediate attention.
Opportunity alerts: Tell me when previously slow products suddenly accelerate (3x normal velocity). Might indicate trending items worth promoting heavily or restocking aggressively.
Systems like Maxmerce’s integrated alerting work across all monitored metrics, learning your baseline patterns and notifying only for statistically significant deviations, not random noise.
Multi-Channel Alert Coordination
For sellers on multiple platforms, coordinated alerting prevents duplicate work and identifies cross-channel issues.
Example: Your wireless headphones inventory drops to 8 units on Amazon and 6 units on eBay simultaneously. Separate platform alerts would ping you twice about same underlying issue. Unified alerting recognizes this is one inventory problem affecting multiple channels, sends single alert with full context: “Wireless headphones low across all channels—reorder immediately.”
Or consider pricing alerts. Competitor undercuts you by 15% on Amazon. If you sell that product on eBay too, you probably need to adjust pricing there as well. Multi-channel systems alert you to competitive threats and suggest cross-platform pricing adjustments.
This coordination saves time and prevents oversights where you fix an issue on one channel but forget to address it on others.
Ready to see your eBay performance in real-time alongside all your sales channels?
Maxmerce’s Analytics module provides instant visibility across eBay, Amazon, and Walmart with 30+ advanced filters and automated alerts that catch issues before they impact your bottom line.
Start your 14-day free trial—no credit card required
Competitive Intelligence: Understanding Your Position in the Market
Your performance metrics only tell half the story. You need context—how you’re performing relative to competitors and market conditions.
Buy Box Monitoring for Multi-Seller Listings
If you sell products where multiple sellers compete (similar or identical items), winning the Buy Box drives 80%+ of sales. You need constant visibility into Buy Box ownership and factors influencing it.
Maxmerce’s Smart Buy Box Optimizer tracks your Buy Box win rate throughout the day, identifies when competitors take it, and analyzes why. Maybe they dropped price $2. Maybe their seller rating improved. Maybe their shipping time beats yours by one day.
Understanding these factors lets you respond strategically. If price is the only difference, automated repricing keeps you competitive. If shipping speed matters, you adjust handling times or use faster carriers. If seller rating is the issue, you focus on customer service improvements rather than chasing price wars you don’t need to fight.
The system can automate responses within your defined rules. Competitor drops price $3, system adjusts your price $3.50 (staying 50 cents below) but only if the new price maintains your 25% minimum margin. You stay competitive without manual monitoring or sacrificing profitability.
Competitor Price Tracking
Beyond Buy Box battles, general competitive pricing intelligence reveals market trends and opportunities.
Tools like Maxmerce’s Competitor Tracking monitor prices across your category, showing average prices, price distribution, and trending direction. If average prices in a category climb 12% over 30 days, that’s market-wide demand increase—you can raise prices confidently. If prices fall 8%, it might indicate oversupply or seasonal decline—adjust expectations and inventory accordingly.
You can also track specific competitor stores. If a major competitor drops prices across 80% of inventory, they might be exiting products or clearing seasonal stock. That’s your opportunity to capture market share they’re abandoning. Without competitive monitoring, you’d miss that strategic opening.
Exporting and Integrating Data for Advanced Analysis
Sometimes you need to take data outside your dashboard for custom analysis, presentations, or financial systems integration.
Strategic Data Exports
Good analytics platforms make exporting flexible. Features like Maxmerce’s Data Export support multiple formats and aggregation levels:
CSV exports for Excel analysis or import into accounting systems. Choose exactly which fields to include, aggregation level (order-level detail versus daily summaries), and date ranges.
Scheduled exports automatically generate and email reports weekly or monthly. Your accountant receives detailed sales data every month without you manually compiling it. Your business partner gets high-level performance summaries every Monday morning.
API access for technical integrations. Connect your dashboard to business intelligence tools like Tableau or Power BI, building custom visualizations that combine sales data with other business metrics.
The key is maintaining single source of truth. Data exports should supplement dashboard usage, not replace it. Export for specific needs (tax preparation, investor reports, advanced statistical analysis), but do day-to-day management in your real-time dashboard where data stays current.
Team Collaboration: Multiple Users with Role-Based Access for eBay Sellers
Once eBay sellers hire help—virtual assistants, inventory managers, marketing specialists—eBay seller dashboard access becomes a collaboration tool.
You don’t want everyone seeing everything. Your inventory manager needs product performance and stock levels but not profit margins or supplier costs. Your marketing assistant needs conversion rates and traffic data but not financial details.
Role-based access controls let you grant appropriate visibility. Features like Maxmerce’s Team Performance Analysis support multiple user accounts with customizable permissions.
Create roles matching responsibilities:
- Owner/Admin: Full access to everything including financial data, account settings, and integrations
- Inventory Manager: View product performance, stock levels, sales velocity, restock alerts; no access to profit margins or supplier costs
- Customer Service: View order details, customer information, return data; limited access to broader analytics
- Marketing Specialist: View traffic, conversion rates, listing performance, promotional results; no access to costs or margins
This approach maintains operational security while enabling team collaboration. Everyone sees the data they need to do their job, nothing more.
Some platforms also support team notes and tagging, letting users comment on specific metrics or flag items for colleague attention. “Inventory manager: These three products need reorder by Friday” or “Marketing: Conversion dropped on this listing after photo change—revert?” Turn your analytics dashboard into a collaborative workspace, not just reporting tool.
Frequently Asked Questions
Conclusion: From Reactive Reporting to Proactive Management
eBay Seller Hub’s 24-48 hour data delays force you into reactive mode—discovering problems days after they start, when fixing them is harder and more costly. Real-time multi-channel analytics flip that dynamic, giving you visibility while you can still prevent issues rather than just responding to them.
The transformation isn’t just faster data—it’s fundamentally different decision-making. Instead of reviewing what happened, you’re monitoring what’s happening now. Instead of post-mortems on failed products, you’re catching declining performance while you can still correct course. Instead of manually compiling data from multiple platforms, you’re analyzing unified metrics that reveal insights invisible in separate views.
For eBay sellers managing 200+ listings or operating across multiple marketplaces, this isn’t a nice-to-have feature—it’s the infrastructure that lets eBay sellers scale without drowning in data. The time eBay sellers save on reporting and the problems they prevent through early detection easily justify the investment in proper eBay seller analytics tools.
Start with the metrics that matter most to your business. Configure alerts for critical thresholds. Build your dashboard gradually, adding complexity as you discover what insights drive better decisions. The goal isn’t perfect data visualization—it’s actionable intelligence that makes you money.
Transform your eBay seller analytics from delayed reports to real-time intelligence
Maxmerce connects your eBay, Amazon, and Walmart accounts into one powerful dashboard with instant updates, 30+ filters, and automated alerts that catch issues before they hurt your bottom line.