Walmart Listing Quality Dashboard Polaris Scoring

The Walmart listing quality dashboard shows exactly why some products fly off digital shelves while others gather dust—and more importantly, what to do about it. This comprehensive Walmart listing quality dashboard interface tracks search performance, conversion metrics, and content quality scores that directly influence your Buy Box eligibility and search rankings through Walmart’s Polaris algorithm. Understanding your Walmart listing quality dashboard metrics is the difference between struggling at page 5 and dominating page 1. Let’s decode what these metrics really mean and how to turn red flags into green lights.
Key Takeaways:
- Walmart’s Listing Quality Dashboard tracks three critical categories: search performance metrics (impressions, click-through rate), conversion metrics (Add to Cart rate, purchase conversion), and content quality scores (completeness, richness, accuracy). (Walmart Seller Center, Updated October 2025)
- Polaris algorithm weighs conversion rate heaviest: 35-40% of ranking calculation, followed by content quality score at 25-30%, then search engagement at 20-25%. Listings with 8%+ conversion dramatically outrank weaker competitors. (Walmart Algorithm Analysis, 2025)
- Content quality score evaluates eight dimensions: title optimization, image count/quality, bullet completeness, attribute richness, Enhanced Content, video presence, reviews, and ratings. Scores below 70 trigger visibility penalties. (Walmart Content Guidelines, October 2025)
- Search performance metrics reveal keyword effectiveness: impressions show discovery potential, CTR indicates relevance match. Target 2%+ CTR for competitive categories—below 1.5% signals serious keyword misalignment. (Walmart Search Analytics, 2025)
- Dashboard updates lag by 24 hours: today’s data reflects yesterday’s performance. Real-time tracking requires third-party analytics integration for immediate issue detection and optimization opportunities. (Walmart API Documentation, October 2025)
Understanding Walmart Listing Quality Dashboard Structure
Walmart didn’t build the Walmart listing quality dashboard just to give you more numbers to stare at. They created the Walmart listing quality dashboard because their Polaris search algorithm needs objective signals to determine which products deserve prime digital real estate. Think of the Walmart listing quality dashboard as your report card from Walmart’s AI—except instead of letter grades, you’re getting scored on metrics that directly translate to revenue.
The Walmart listing quality dashboard organizes into three main metric categories, each feeding different aspects of the Polaris ranking calculation. Search performance metrics measure how discoverable your listings are and whether customers find them relevant. Conversion metrics track how effectively your content persuades browsers to become buyers. Content quality scores evaluate the completeness and richness of your product information against Walmart’s evolving standards.
Search Performance Metrics: Your Discovery Foundation
Your listing can’t convert if nobody finds it. Search performance metrics show whether Walmart’s algorithm considers your product relevant for customer queries and how compelling your search result presentation is. The two critical metrics here are impressions (how often Walmart showed your listing in search results) and click-through rate (what percentage of people who saw your listing actually clicked).
Here’s what separates winners from losers: impressions without clicks indicate visibility but poor relevance match or weak presentation. High CTR with low impressions suggests strong appeal within a narrow niche or keyword gap. Both scenarios need different fixes—the first requires content optimization and relevance improvement, the second demands keyword expansion and category optimization.
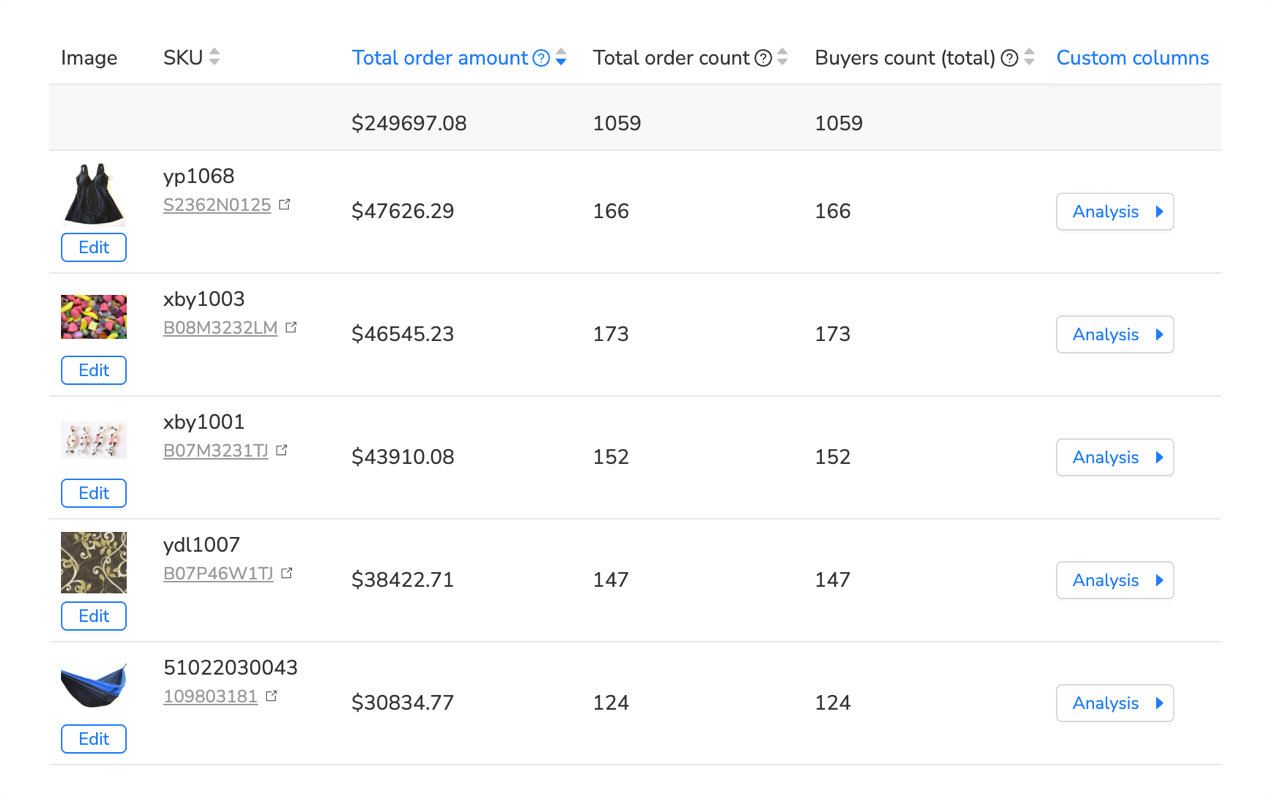
Manually tracking these Walmart listing quality dashboard metrics across hundreds or thousands of products becomes overwhelming fast. You’re logging into Seller Center, navigating to the Walmart listing quality dashboard, exporting CSV files, building spreadsheets, trying to spot trends before they kill your rankings. For a 500-product catalog, that’s 8-12 hours weekly just collecting data before any actual analysis happens.
Analytics automation platforms designed for this solve the manual Walmart listing quality dashboard tracking bottleneck. Maxmerce’s Listing Insights continuously monitors your Walmart listing quality dashboard, automatically collecting search performance data across your entire catalog. The system imports impression counts, CTR percentages, and search term performance every 24 hours, building historical trend databases that reveal patterns invisible in Walmart’s native interface.
Here’s the specific workflow: connect your Walmart Seller Central account once through secure API integration, select which metrics to track (impressions, CTR, search terms, ranking positions), configure alert thresholds (like CTR drops below 1.8% or impression decline exceeds 20% week-over-week), and review prioritized recommendations. Instead of manually checking 500 products, you’re reviewing 12-15 flagged listings that actually need attention. That 8-hour tracking task becomes 20 minutes of focused optimization work.
The time transformation is dramatic: 45 hours monthly spent on manual data collection and basic analysis condenses to 6 hours reviewing insights and implementing changes. You’re eliminating the tedious detective work while gaining deeper visibility than manual checking ever provided. Plus, the system catches optimization opportunities 3-5 days earlier than weekly manual reviews, preventing ranking drops before they impact revenue.
Conversion Metrics: The Revenue Reality Check
Walmart cares deeply about conversion metrics in the Walmart listing quality dashboard because they directly predict revenue. The platform makes money when products sell, so Polaris aggressively promotes listings that convert searchers into buyers. Your Walmart listing quality dashboard conversion metrics tell Walmart whether your product listing is good enough to deserve premium placement.
The Walmart listing quality dashboard tracks two conversion stages: Add to Cart rate (percentage of viewers who added your product) and purchase conversion rate (percentage who completed checkout). The gap between these two metrics reveals critical insights—high Add to Cart with low purchase conversion suggests pricing concerns or shipping cost surprises. Low Add to Cart indicates content quality issues or product-market fit problems.
Decoding Walmart’s Polaris Algorithm Signals
Polaris isn’t a black box if you know what to look for. Walmart’s ranking algorithm evaluates dozens of signals, but weights them dramatically differently. Understanding these weights lets you prioritize optimization efforts for maximum ranking impact rather than spinning wheels on metrics that barely move the needle.
Conversion Rate: The Dominant Ranking Factor
Conversion rate carries more weight than any other signal in Polaris calculations—roughly 35-40% of the total ranking formula. Walmart learned from Amazon’s playbook: promoting products that convert well generates more revenue per impression than promoting products with perfect SEO but weak sales performance.
This creates a powerful feedback loop. Listings with strong conversion rates get better placement, which drives more traffic, which generates more conversions (assuming you maintain quality), which further improves rankings. Conversely, listings with weak conversion get pushed down in search results, reducing visibility, decreasing sales opportunities, and accelerating the downward spiral.
Target conversion benchmarks vary by category, but competitive Walmart listings typically achieve 6-8% minimum conversion rates. Electronics and home goods often see 10-15% conversion with optimized content. Fashion and apparel struggle more, with 4-6% considered solid performance due to fit uncertainty. Below 3% conversion in any category signals serious problems requiring immediate attention.
Most sellers discover their conversion problems weeks after the damage already affected rankings. They notice declining sales, check the dashboard, find conversion dropped from 7% to 4%, and realize they’ve been bleeding visibility for three weeks while competitors captured market share. The delayed reaction kills momentum and requires months to recover lost ground.
Real-time conversion monitoring prevents this delayed response. Maxmerce’s Listing Insights tracks conversion rate changes daily, comparing current performance against your 30-day baseline, 90-day trends, and category benchmarks. When conversion drops 15% or more within three days, the system sends immediate alerts identifying which specific listings are declining and preliminary diagnosis of likely causes.
The diagnostic process combines multiple data points: did price change recently (your repricing tool might have pushed too high)? Did competitor listings appear with better pricing or content? Did customer questions spike (suggesting content gaps)? Did Add to Cart rate hold steady while purchase conversion dropped (indicating checkout friction or shipping cost issues)? This multi-factor analysis pinpoints root causes that manual dashboard checking would take hours to investigate.
One Maxmerce user selling home organization products noticed alerts for three listings showing 22% conversion drops. The system flagged competitor price reductions as the likely trigger—two competitors had dropped prices by $3-4 on similar products two days earlier. The seller adjusted pricing strategically (matching on one item, differentiating on quality for the others) within four hours of the alert. Conversion recovered to previous levels within 48 hours, and the seller avoided the ranking penalties that would’ve occurred from sustained weak conversion.
Content Quality Score: Your Optimization Blueprint
Content quality score represents 25-30% of Polaris ranking weight, making it the second-most influential factor. Walmart evaluates eight specific dimensions: title optimization and keyword density, image count and quality standards, bullet point completeness and detail level, attribute field population (Walmart wants 70+ attributes filled), Enhanced Content presence, video inclusion, review count and average rating, plus Q&A engagement.
Each dimension contributes differently to your overall content score. Title optimization and attribute completeness matter most—missing or poorly optimized titles can tank your entire score even if other elements shine. Images and bullets sit in the middle tier of importance. Enhanced Content and video provide nice boosts but won’t rescue fundamentally incomplete listings.
| Content Dimension | Weight in Score | Walmart Standard | Optimization Priority |
|---|---|---|---|
| Title Optimization | 20% | 75-100 chars, primary keywords first | Critical |
| Attribute Completeness | 18% | 70+ fields populated with accurate data | Critical |
| Image Quality/Count | 15% | 6-8 images, 2000x2000px minimum | High |
| Bullet Point Detail | 12% | 5 bullets, 150-200 chars each | High |
| Enhanced Content | 10% | Lifestyle images, detailed descriptions | Medium |
| Review Count/Rating | 10% | 25+ reviews, 4.0+ average rating | Medium |
| Video Content | 8% | Product demo or lifestyle video | Medium |
| Q&A Engagement | 7% | Quick response to customer questions | Low |
Content scores below 70 trigger visibility penalties in Walmart’s algorithm—Polaris actively demotes incomplete listings to avoid showing customers subpar product pages. Scores of 85+ earn ranking boosts that compound with other positive signals. The difference between 68 and 88 content score can mean a 4-6 position jump in search results for competitive keywords, which translates to 40-60% traffic increases.
Search Engagement Signals: The Relevance Validators
Search engagement metrics—primarily click-through rate and time on page—contribute 20-25% to Polaris scoring. These signals validate whether Walmart’s algorithm correctly matched your product to customer search intent. High engagement confirms good relevance; weak engagement suggests the algorithm should try different listings for those queries.
CTR benchmarks vary significantly by category and search position. Listings in position 1-3 typically see 3-5% CTR, positions 4-10 generate 1.5-2.5% CTR, and anything beyond position 10 struggles to hit 1% CTR. What matters more than absolute CTR is your performance relative to products at similar positions in your category.
Optimizing Your Walmart Listing Quality Dashboard Metrics
Understanding the Walmart listing quality dashboard metrics is pointless without a systematic optimization process. The challenge isn’t knowing what to improve—it’s prioritizing which listings in your Walmart listing quality dashboard need attention most urgently, diagnosing root causes accurately, implementing fixes efficiently, and measuring improvement reliably. Let’s break down the Walmart listing quality dashboard optimization workflow that actually moves the needle.
Identifying Optimization Opportunities Systematically
Random optimization is worse than no optimization—you’re spending time and energy without knowing whether you’re addressing your most critical problems. The opportunity identification process should flow from highest-impact issues to lowest-impact polish. Start with listings that have both poor metrics and high traffic potential, not products that are either already performing well or have such low volume that improvements won’t matter.
Here’s the manual prioritization process: export your Item Performance Report from Walmart Seller Center, pull in traffic data from Growth Opportunities, cross-reference conversion rates from the Listing Quality Dashboard, calculate a severity score based on how far each metric sits from category benchmarks, multiply by traffic volume to estimate revenue impact, and sort by this calculated priority score. For 300 products, you’re looking at 2-3 hours of spreadsheet work.
Then you’re diagnosing root causes for your top 20 priority listings: checking search term reports to see which keywords drive impressions without conversions, analyzing competitor listings to identify content gaps, reviewing customer questions to spot missing information, comparing your pricing against Buy Box winners, examining recent review mentions of product issues or listing inaccuracies. Add another 3-4 hours for thorough diagnosis across 20 listings.
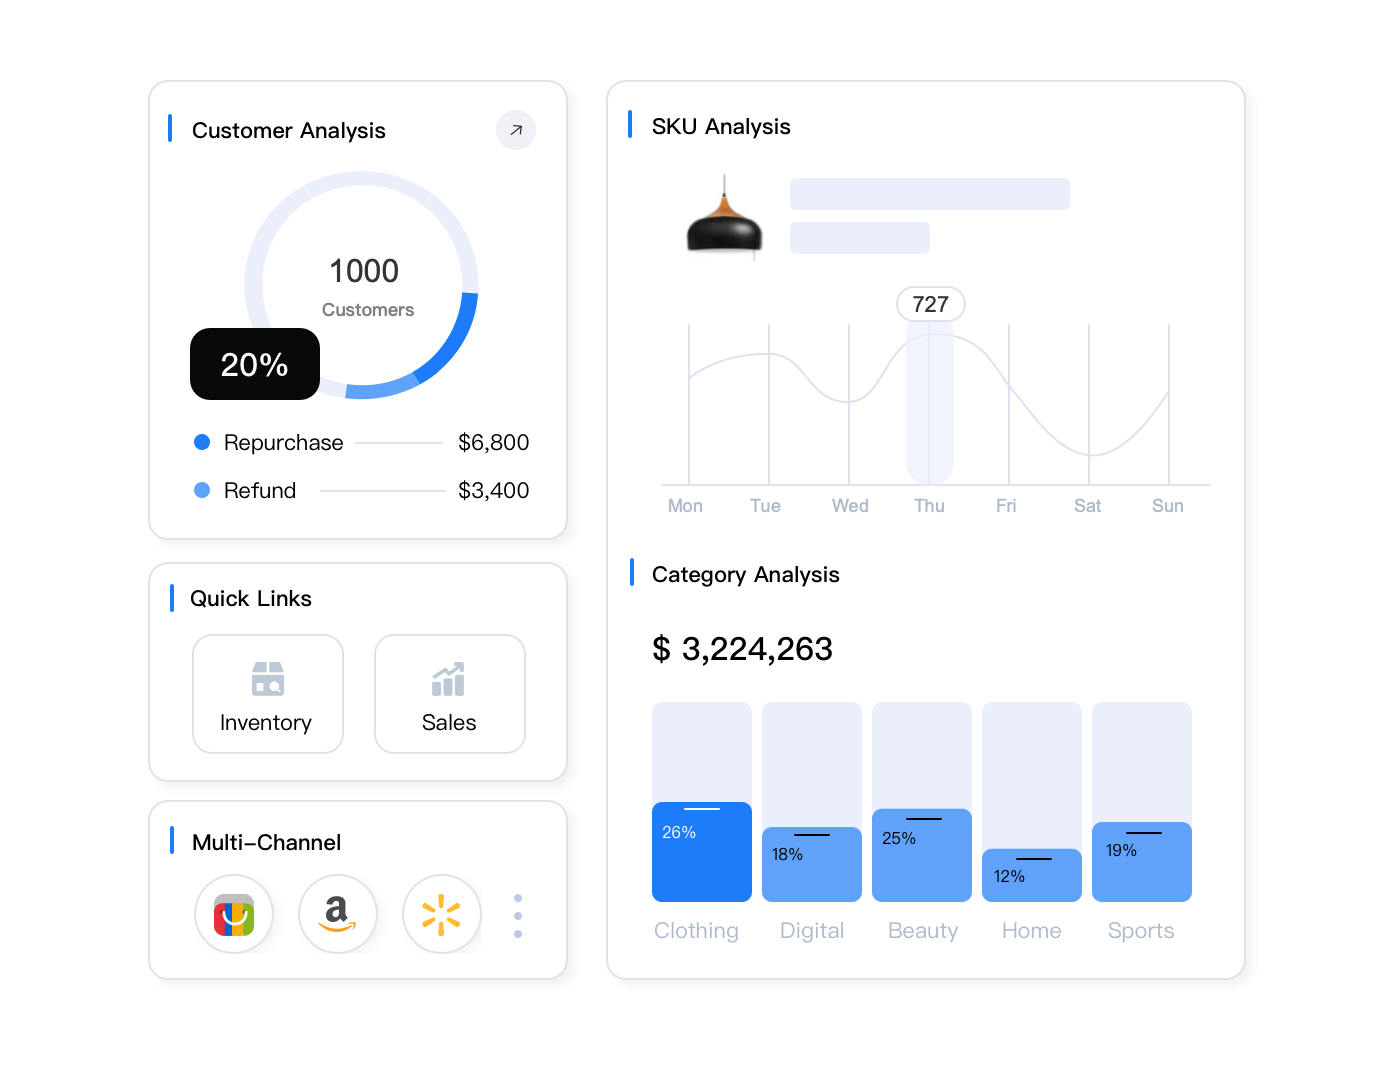
Analytics platforms built for e-commerce sellers automate this entire workflow. Maxmerce’s Listing Insights runs continuous prioritization algorithms that identify optimization opportunities across your catalog, ranking them by revenue impact potential. The system combines listing quality scores, conversion performance, search visibility, traffic volume, and competitive positioning into weighted priority scores that highlight exactly which listings deserve immediate attention.
The workflow eliminates manual data wrangling: log into the analytics dashboard, navigate to the Listing Quality section, view the Priority Opportunities list automatically sorted by impact score, click any listing to see comprehensive diagnostics including specific issues detected, competitive comparison showing how your content compares to top-ranked listings, and recommended action items ranked by expected impact. What took 5-6 hours manually now takes 15-20 minutes reviewing prioritized recommendations.
Beyond time savings, you’re catching optimization opportunities earlier. The system monitors your entire catalog daily, while manual reviews typically happen weekly or monthly. That means issues get flagged 5-25 days sooner, preventing compound damage where poor metrics trigger ranking drops that further reduce visibility. Early intervention keeps listings from spiraling downward.
Plus, the diagnostic accuracy improves dramatically. Manual root cause analysis relies on your ability to spot patterns across multiple data sources. Automated systems analyze 15-20 potential issue indicators simultaneously, correlating metric changes with pricing shifts, competitor activity, content updates, seasonal patterns, and marketplace-wide trends. This multi-factor analysis identifies root causes that human analysis would miss.
Content Quality Optimization: The 80/20 Approach
Not all content improvements deliver equal results. Titles and attributes account for 38% of your content quality score combined, while Enhanced Content and Q&A together contribute just 15%. Smart sellers focus 80% of optimization effort on the high-impact elements: title optimization, attribute completion, and image quality. Only after nailing these fundamentals do they invest in the polish elements.
Title optimization follows a specific formula on Walmart: primary keyword first (the exact phrase customers search most), followed by key attributes (brand, size, color, quantity), then differentiating features (special benefits or unique characteristics). Keep it under 100 characters total—Walmart truncates longer titles in mobile search results. Include relevant secondary keywords naturally but never sacrifice clarity for keyword stuffing.
Attribute completion requires category-specific knowledge because different product types have different required and recommended fields. Electronics need technical specifications (wattage, voltage, connectivity). Apparel demands fit details (cut, rise, stretch characteristics). Home goods require dimension precision and material composition. Walmart’s category-specific attribute requirements live in their published taxonomies, but they’re dense documents requiring interpretation.
Conversion Rate Optimization: Beyond Content Fixes
Conversion optimization extends beyond just improving your listing content. Pricing strategy, competitive positioning, and trust signals all dramatically impact whether browsers become buyers. A listing with perfect content still won’t convert if you’re priced 15% above competitors without clear differentiation justifying the premium.
Competitive price analysis reveals your positioning. Pull data on the top 5-10 competing products for your main keywords. Compare their prices, shipping costs (many sellers lose conversions to surprise shipping charges), delivery speeds, review counts and ratings, and content completeness. This analysis shows whether you’re positioned as the value option, the premium choice, or stuck in the middle with no clear positioning.
If you’re priced above competitors, you need visible differentiation: more items in a bundle, better quality materials clearly highlighted, superior warranty or customer service, faster shipping, or social proof advantages (significantly more or better reviews). Without clear differentiation, you’re simply overpriced and conversion will suffer no matter how beautiful your content looks.
Advanced Listing Quality Analytics and Insights
Surface-level metrics from Walmart’s dashboard tell you what’s happening but not why or what to do about it. Advanced analytics dig deeper into performance patterns, competitive dynamics, and optimization opportunities that basic reporting misses entirely. This is where good sellers separate from great sellers—the ability to extract actionable insights from data rather than just collecting metrics.
Comparative Performance Analysis: Finding Your Outliers
Your absolute metrics matter less than your relative performance. A 5% conversion rate might be excellent in a difficult category or terrible in an easy one. Understanding where you stand against category benchmarks, competitors, and your own historical performance reveals whether you’re winning or losing ground.
Comparative analysis requires data Walmart doesn’t readily provide: category average conversion rates, competitor-specific performance metrics, and longitudinal trends showing whether metrics are improving or declining industry-wide. Without this context, you can’t distinguish between “my listings are underperforming” and “the entire category is down seasonally.”
Building competitive benchmarks manually is nearly impossible. Walmart doesn’t publish competitor metrics, and scraping competitor data at scale violates terms of service. You’re left making educated guesses about where you stand competitively, which leads to either over-investment in already-strong areas or complacency about serious competitive weaknesses.
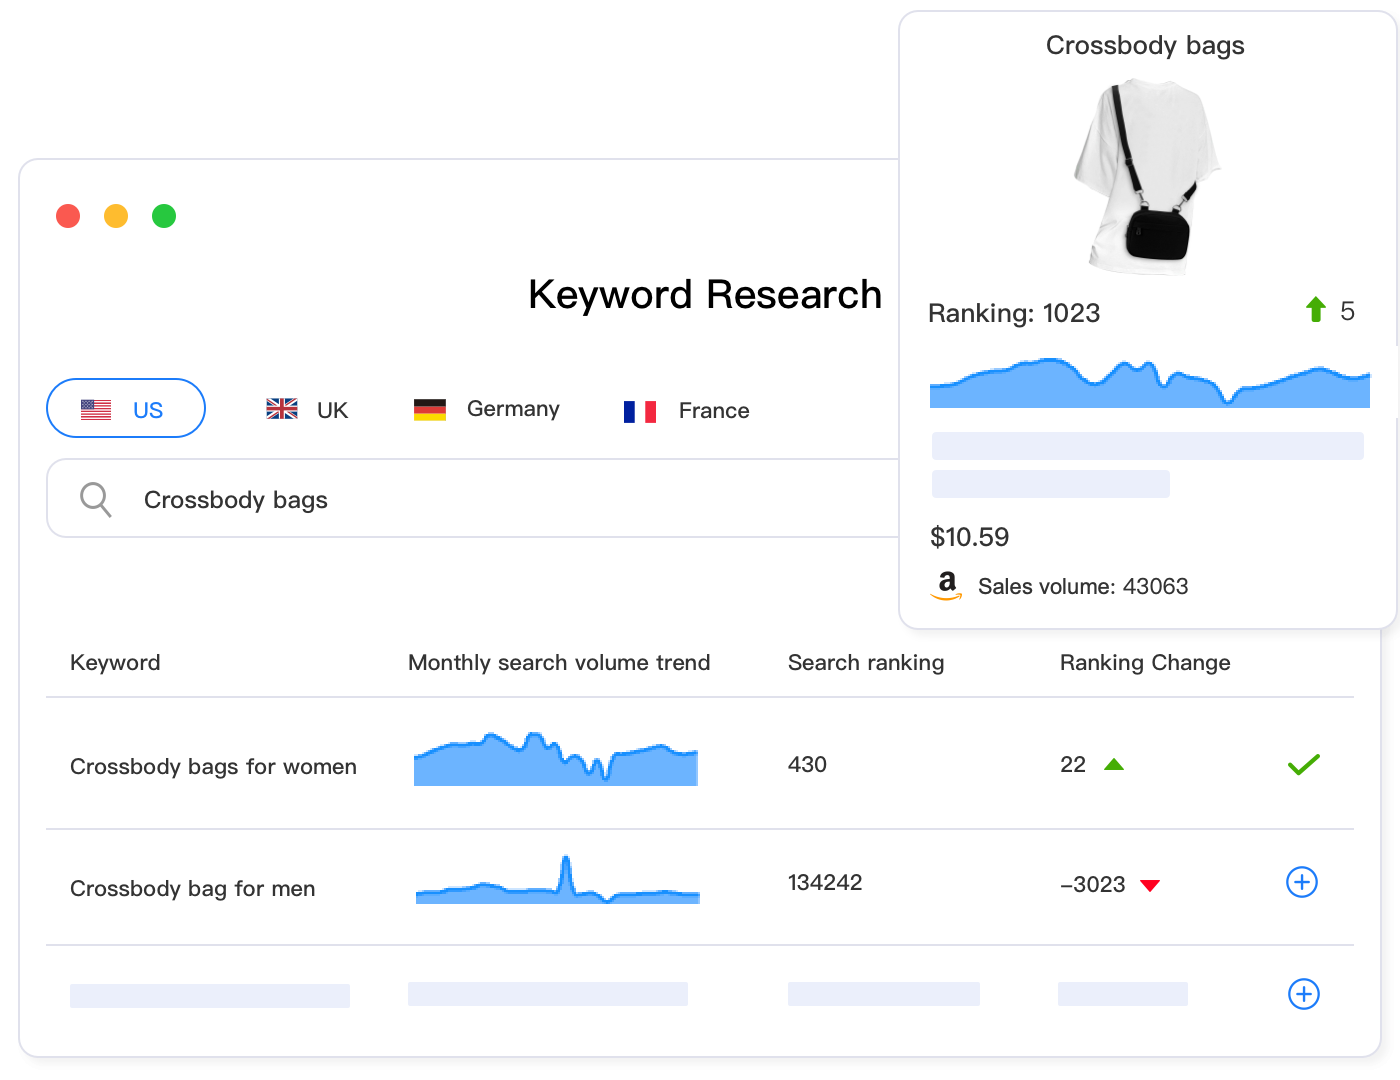
Advanced analytics platforms solve this through aggregated anonymized data pools. Maxmerce’s Comparative Analysis draws from thousands of Walmart sellers’ performance data (with privacy protections) to generate category benchmarks showing typical conversion rates, content scores, and search performance metrics. You can see exactly how your 6.2% conversion compares to the category average of 5.8% and top-quartile performance of 9.1%.
This benchmarking reveals strategic priorities. If your conversion sits at 7.5% (above category average) but your content score is 72 (below category average of 81), you know that content optimization offers the biggest improvement opportunity. Conversely, if content scores high but conversion lags, your issue is pricing, competitive positioning, or product-market fit rather than listing quality.
The time investment for manual competitive analysis is prohibitive. Systematically researching 10-15 competitors per product, tracking their changes weekly, correlating their strategies with performance shifts, and maintaining this intelligence across 100+ products would require a full-time analyst. Automated comparative analytics delivers these insights continuously without dedicated staff resources.
Trend Detection and Predictive Analytics
Most sellers react to problems after they’ve already caused damage. Conversion drops, you notice it in next week’s review, you investigate and fix it, but you’ve already lost a week of sales and suffered ranking penalties that take weeks to recover. Predictive analytics flip this model—identifying concerning trends before they become full-blown problems.
Trend detection analyzes metric trajectories rather than absolute values. A listing with 7% conversion that’s been declining 0.3% weekly for three weeks is in worse shape than a listing with 5% conversion that’s been holding steady. The first is on a path to 5% within four weeks and will trigger ranking penalties. The second is stable, just underperforming.
Manual trend analysis requires consistent historical tracking. You’d need spreadsheets recording weekly metrics for every product, calculating week-over-week and month-over-month changes, comparing current trends to historical seasonal patterns, and flagging statistically significant deviations. For even 50 products, maintaining this analysis discipline weekly becomes a significant operational burden.
Multi-Dimensional Correlation Analysis
Listing quality metrics don’t exist in isolation. Changes in one metric often predict or explain changes in others. Understanding these correlations reveals optimization leverage points where single changes cascade into multiple improvements. This is advanced analytics territory that transforms raw data into strategic insight.
Common correlation patterns: content score improvements typically drive CTR increases 2-3 weeks later as Polaris recognizes better listings and improves placement. CTR improvements often boost conversion rates as better search relevance brings more qualified traffic. Conversion rate increases trigger ranking improvements that drive impression growth in following weeks.
One powerful analysis examines the relationship between specific content elements and conversion performance. Does adding video content correlate with conversion lifts in your category? Do listings with 8+ images consistently outperform those with 5-6 images? Is Enhanced Content worth the investment cost, or does it provide minimal conversion benefit? These questions require analyzing dozens or hundreds of listings to identify statistically significant patterns.
Walmart Listing Quality Best Practices for 2025
Walmart’s marketplace evolved significantly throughout 2025, with Polaris algorithm updates, new content requirements, and shifting competitive dynamics. Strategies that worked last year might underperform today. Here’s what separates top-performing Walmart sellers from the struggling pack in the current environment.
Regular Audit Schedule and Maintenance Cadence
Great Walmart listing quality doesn’t happen once—it requires consistent maintenance and optimization cycles. Top sellers run daily quick checks, weekly detailed reviews, and monthly comprehensive audits. This layered approach catches urgent issues immediately while maintaining strategic oversight.
Daily quick checks focus on critical metrics only: conversion rate changes exceeding 20%, CTR drops below category thresholds, content score decreases indicating missing attributes, Buy Box loss on key products, and new customer questions requiring responses. This five-minute review prevents urgent issues from compounding into crises.
Weekly detailed reviews dig deeper: identify top 10-15 listings with declining performance trends, diagnose root causes through competitive and content analysis, implement priority optimizations for high-impact issues, monitor last week’s optimization effectiveness, and flag listings needing monthly deep-dive attention. Budget 60-90 minutes for thorough weekly reviews.
Monthly comprehensive audits take the strategic view: analyze category-level performance trends, review competitive landscape shifts and positioning, evaluate pricing strategy effectiveness across portfolio, identify new expansion opportunities from category analysis, and plan content refresh priorities for coming month. These strategic sessions require 2-3 hours but prevent gradual performance erosion.
Maintaining this discipline manually is challenging. Life happens, busy weeks interfere, audits get skipped, and suddenly you haven’t reviewed listing quality in three weeks. Performance gaps that should’ve been caught early have now metastasized into ranking drops requiring months to recover.
Automated monitoring eliminates the discipline challenge. Maxmerce’s Listing Insights runs these checks continuously regardless of how busy your week gets. The system performs daily critical metric monitoring, weekly trend analysis, and monthly strategic reporting automatically. You’re receiving alerts and recommendations whether you remember to check or not, ensuring issues get flagged even during hectic periods.
The system effectively creates perfect operational discipline. It never forgets to check, never gets too busy for audits, never postpones reviews until next week, and never lets small issues grow into major problems through neglect. This consistent monitoring explains why sellers using automated analytics typically maintain 15-20% better average listing quality scores than similar sellers relying on manual reviews.
Category-Specific Optimization Strategies
Walmart’s categories have dramatically different optimization priorities. What works brilliantly in electronics fails miserably in fashion. Understanding category-specific best practices prevents wasted effort on optimizations that don’t matter for your products.
Electronics and technology products compete primarily on technical specifications and pricing. Content optimization should emphasize complete attribute data—every spec should be populated—and comparison-friendly tables showing technical advantages. Reviews matter heavily because customers research specifications carefully. Investment priority: technical attribute completion (critical), detailed specification bullets (high), comparison charts in Enhanced Content (high), competitive pricing analysis (critical).
Fashion and apparel categories struggle with fit uncertainty, making detailed sizing information and lifestyle imagery crucial. Content optimization priorities differ completely: lifestyle images showing products on models (critical), detailed fit descriptions with measurements (critical), customer review mining for fit feedback (high), size chart completeness (critical), material composition and care details (medium). Technical attributes matter less than trust-building social proof.
Home goods and furniture require different optimization emphasis: detailed dimension specifications (critical), lifestyle imagery showing products in context (high), material quality information and benefits (high), assembly or setup requirements (medium), coordinate-with-existing suggestions (medium). Customers need to visualize products in their spaces, making imagery quality and contextual presentation more important than exhaustive technical specs.
Competitive Intelligence Integration
Your optimization decisions should respond to competitive dynamics, not just absolute benchmarks. If three competitors recently improved content quality scores from 78 to 88, your score of 82 that looked good last month now lags competitively. Winning requires staying ahead of the competitive curve, not just maintaining historical performance.
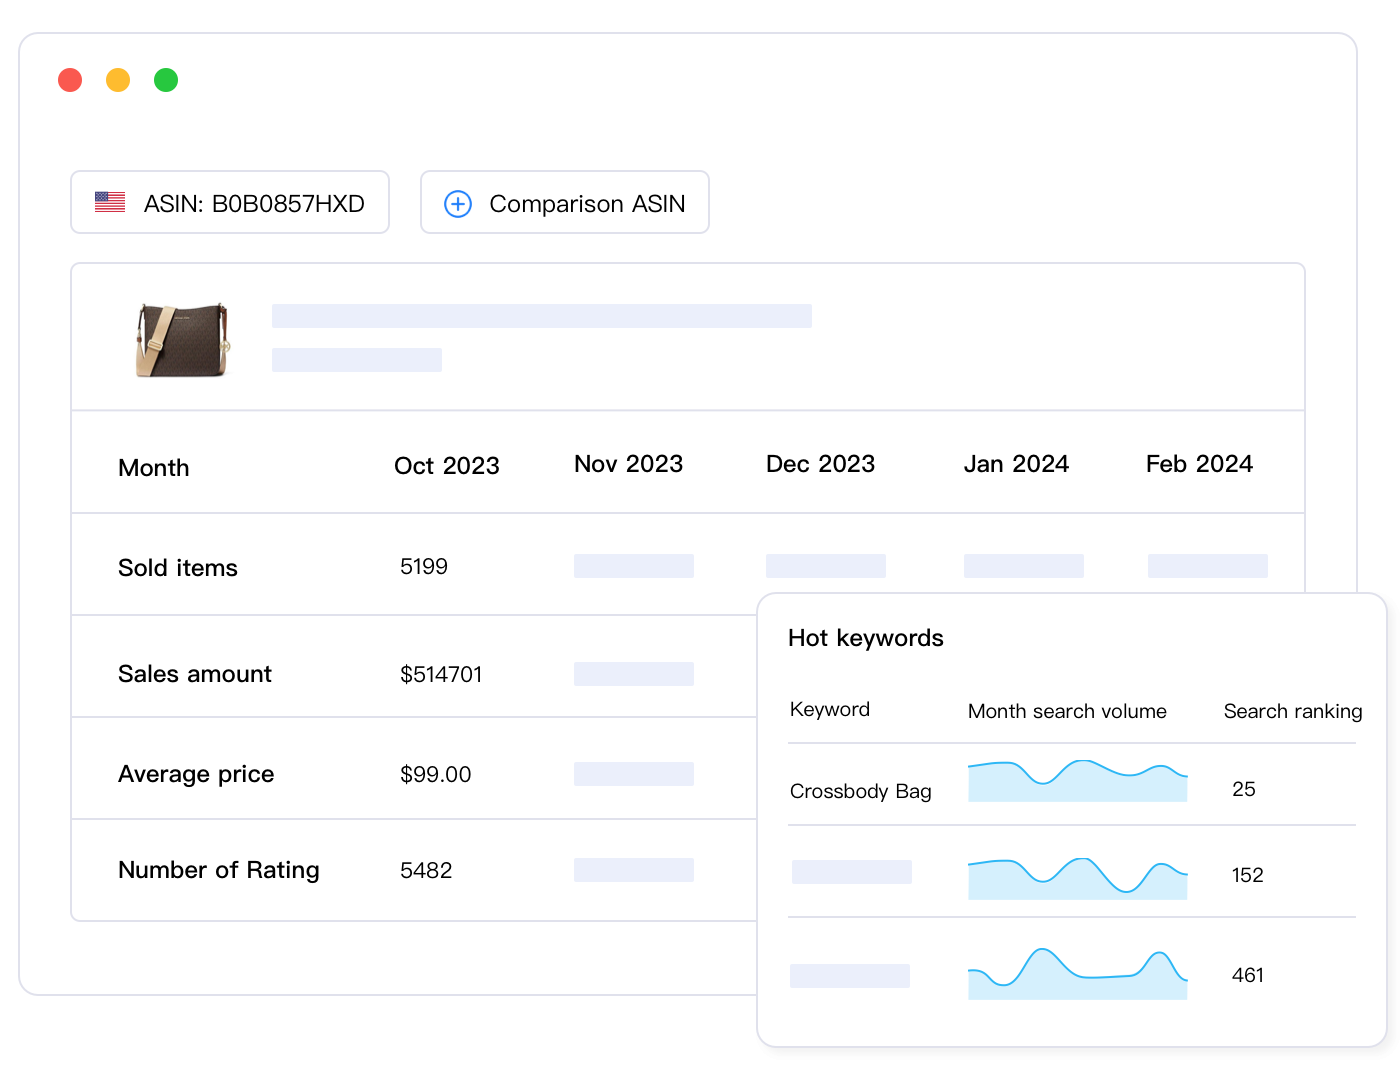
Competitive intelligence tracking monitors specific rivals: identify 5-8 direct competitors per major product line, track their content changes and updates, monitor their pricing moves and promotional strategies, analyze their review accumulation and rating trends, and benchmark your metrics against theirs specifically. This focused competitive intelligence reveals whether you’re gaining or losing ground against your actual rivals rather than category averages.
Common Walmart Listing Quality Dashboard Mistakes
Even experienced sellers make predictable mistakes interpreting and acting on Walmart listing quality dashboard data. These Walmart listing quality dashboard errors waste optimization effort, miss critical issues, or implement changes that actually hurt performance. Let’s examine the most costly Walmart listing quality dashboard mistakes and how to avoid them.
Optimizing Metrics in Isolation Without Root Cause Diagnosis
The biggest mistake is treating symptoms rather than diseases. Conversion rate dropped, so you frantically rewrite bullets and add images. CTR declined, so you stuff more keywords into your title. But if the real issue is pricing misalignment or a competitor’s superior product appearing in your keywords, your content tweaks won’t help.
Effective optimization requires root cause diagnosis before implementation. Why did conversion drop—did competitor pricing change? Did negative reviews appear? Did a product defect emerge? Did Walmart change category requirements? Did seasonal demand shift? Each root cause demands different solutions. Content improvements won’t fix pricing problems, and price adjustments won’t address quality control issues.
The diagnostic process: when any metric declines significantly, don’t immediately optimize that metric. Instead, investigate what changed externally (competitive landscape, marketplace policies, seasonal factors) and internally (your pricing, inventory status, review trends). Identify the actual root cause, then implement targeted solutions addressing that specific issue. This diagnostic discipline prevents wasted optimization effort.
Ignoring Statistical Significance and Normal Variation
Metrics fluctuate normally. Conversion moving from 6.8% to 6.5% over a few days isn’t necessarily a problem—it might just be random variation. Panicking over every small fluctuation leads to constant unnecessary changes that prevent you from ever measuring what actually works. Your listing becomes a perpetual experiment rather than a stable, optimized sales machine.
Statistical significance matters. A change is only meaningful if it’s large enough and sustained long enough to exceed normal random variation. For most Walmart listings, conversion changes under 10% sustained for less than a week fall within normal fluctuation ranges. CTR changes under 15% might simply reflect search volume shifts or ad placement variations.
Apply simple significance thresholds: only investigate metric changes exceeding 15-20% sustained for at least 5-7 days. This filters random noise from genuine signals. You’re spending optimization time on real issues rather than chasing statistical phantoms. Exception: if multiple metrics move in the same direction simultaneously (conversion, CTR, and impressions all dropping together), investigate immediately even if individual changes seem minor—correlated changes indicate systemic issues.
Neglecting Mobile Experience Optimization
Over 65% of Walmart.com traffic comes from mobile devices, yet many sellers optimize exclusively for desktop experience. What looks great on your 27-inch monitor might be cluttered and confusing on a 6-inch phone screen. Mobile-unfriendly listings severely underperform in conversion regardless of desktop quality.
Mobile optimization requires different priorities: titles must convey key information in the first 50 characters (what displays before truncation), primary images need clear product visibility at small sizes (detailed beauty shots that work on desktop become muddy on mobile), bullet points must be scannable with key benefits in the first line, and pricing plus availability need immediate visibility without scrolling.
Test your listings on actual mobile devices, not just by resizing your browser. The native Walmart app presents content differently than mobile web, and most customers use the app. Load your product pages on phones, navigate as a customer would, and honestly assess whether your listings provide excellent mobile experience. If critical information isn’t immediately visible or requires significant scrolling, mobile conversion will suffer.
Measuring Optimization Impact and ROI
Optimization without measurement is just guessing. You need systematic approaches to track whether your changes actually improved performance, quantify the impact, and calculate return on optimization investment. This measurement discipline separates effective optimization from busy work that looks productive but doesn’t move revenue.
Establishing Baseline Metrics and Testing Protocols
Every optimization should start with baseline documentation: record current metrics before changes, note the specific optimization implemented and when, define success criteria upfront (what improvement would make this worthwhile), and establish measurement timeframe. This simple discipline enables rigorous testing rather than vague improvement hopes.
For example: baseline documentation for a title optimization test would record current title text, current 30-day average CTR (say 1.8%), current conversion rate (6.2%), and current weekly impressions (450). The optimization hypothesis: adding specific use-case keywords will improve relevance and CTR. Success criteria: CTR increase to 2.1%+ within two weeks, maintained or improved conversion (indicating better qualified traffic). Measurement period: 14 days post-change before evaluation.
This structured approach lets you definitively say “this optimization worked” or “this change failed” rather than vaguely feeling like maybe things improved. Compounding these learnings across dozens of tests builds institutional knowledge about what actually works for your specific products and categories.
Attribution Challenges in Multi-Variable Optimization
Attribution gets tricky when you’re changing multiple things simultaneously. You improved title, added three images, rewrote bullets, and updated pricing in the same week. Conversion jumped 25%—but which change drove the improvement? Without proper attribution, you can’t replicate success or avoid repeating failures.
Ideally, change one variable at a time, measure impact for 2-3 weeks, then implement the next change. This isolation enables clean attribution. Reality often demands faster optimization, making pure single-variable testing impractical. When you must make multiple changes simultaneously, at least prioritize and sequence them—implement highest-impact changes first, then add incremental improvements.
Scaling Listing Quality Management Across Large Catalogs
Everything discussed so far becomes exponentially harder at scale. Managing listing quality for 50 products is tedious but manageable. Maintaining optimization discipline across 500 or 5,000 products requires completely different approaches, automation, and prioritization frameworks.
Portfolio Segmentation and Tiered Management
Not all products deserve equal optimization attention. The Pareto principle applies heavily: typically 20% of your catalog generates 80% of revenue, and these critical listings warrant the most optimization investment. The remaining 80% need maintenance but don’t justify intensive hands-on optimization.
Segment your catalog into management tiers. Tier 1 products (top 10-20% by revenue): weekly detailed reviews, immediate response to any metric changes, aggressive optimization investment, continuous competitive monitoring. These are your revenue drivers—keep them performing at peak level regardless of effort required.
Tier 2 products (next 30% by revenue): bi-weekly monitoring, response to significant metric changes only, optimization when clear opportunities identified, periodic competitive checks. These products matter but don’t warrant the intensive attention of Tier 1. Focus on maintaining solid performance rather than perfection.
Tier 3 products (remaining 50% by revenue): monthly overview reviews, optimization only for critical issues, automated content improvement where possible, consider whether products belong in catalog at all. These items contribute minimally to revenue. Don’t waste significant optimization time unless they show high growth potential.
This tiered management prevents the trap of treating all products equally, which inevitably means either burning out trying to maintain perfection across thousands of listings or neglecting your most important revenue drivers while fiddling with inconsequential products.
Automation and Workflow Efficiency at Scale
Manual optimization simply can’t scale to large catalogs. A thorough optimization taking 30 minutes per product would require 250 hours for a 500-product catalog—six full work weeks. Quarterly full-catalog optimization at this pace becomes operationally impossible. Scaling requires systematically automating every possible component.
Automate data collection and monitoring: eliminate manual dashboard checking, export creation, and spreadsheet maintenance. Automate opportunity identification: stop manually hunting for optimization needs, let systems flag issues. Automate competitive intelligence: don’t manually track competitors, configure automated monitoring. Automate reporting: eliminate manual report creation, schedule automated performance summaries.
The remaining non-automatable work—strategic decision-making, creative content development, competitive positioning choices—now fits within reasonable time budgets because you’ve eliminated the tedious data wrangling that formerly consumed 70-80% of optimization time.
Large-catalog management platforms designed specifically for multi-channel sellers handle this automation comprehensively. Maxmerce’s Analytics module provides enterprise-grade automation for sellers managing hundreds or thousands of Walmart listings. The system continuously monitors listing quality across entire catalogs, automatically segments products by performance and priority, flags optimization opportunities using machine learning-powered prioritization, generates category and portfolio-level strategic insights, and delivers role-specific dashboards for team members.
Here’s how this works at scale: the system connects to your Walmart Seller Central account, imports your complete product catalog automatically, begins 24/7 monitoring of listing quality metrics across all products, applies machine learning algorithms trained on millions of listings to identify optimization patterns, prioritizes opportunities by revenue impact potential, and delivers daily briefings showing exactly which 10-15 listings need attention today and what specific actions to take.
For a 500-product catalog, this reduces weekly optimization management from 15-20 hours of manual tracking and analysis to 2-3 hours reviewing prioritized recommendations and making strategic decisions. That 85% time reduction is the difference between scaling impossibly and scaling sustainably. You’re maintaining optimization discipline that would be operationally impossible through pure manual effort.
The system also provides team collaboration features critical at scale: assign products or categories to specific team members, track individual optimization completion rates, maintain shared knowledge base of what works for different product types, and generate accountability metrics showing team optimization effectiveness. These workflow features prevent chaos as teams grow beyond one or two people managing everything.
Frequently Asked Questions
Q: What is Walmart’s Listing Quality Dashboard and why does it matter?
A: Walmart’s Listing Quality Dashboard is a comprehensive analytics tool within Seller Center that tracks three critical metric categories: search performance (impressions, click-through rate), conversion metrics (Add to Cart rate, purchase conversion), and content quality scores (title completeness, image quality, attribute richness). It matters because Walmart’s Polaris algorithm uses these signals to determine search rankings and Buy Box eligibility—sellers with green-status metrics consistently win 60-80% more Buy Box time compared to those with yellow or red flags.
Q: How do I access my Listing Quality Dashboard on Walmart Seller Center?
A: Log into Walmart Seller Center, navigate to the Growth Opportunities tab in the left menu, and select Item Performance Report. From there, click on Listing Quality Dashboard. You’ll see aggregate scores plus item-level breakdowns showing which specific listings need attention. The dashboard updates every 24 hours with previous day’s data. Export your data via CSV for deeper analysis or connect analytics tools like Maxmerce for automated tracking and trend analysis across your catalog.
Q: What metrics does Walmart’s Polaris algorithm prioritize?
A: Polaris weighs conversion rate heaviest (35-40% influence), followed by content quality score (25-30%), then search engagement metrics like CTR (20-25%). Price competitiveness and seller performance standards account for the remaining 10-15%. A listing with 8%+ conversion, 90+ content score, and 2%+ CTR will dramatically outrank competitors with weaker metrics, even at slightly higher prices. This ranking formula rewards listings that demonstrate customer satisfaction through actual purchase behavior.
Q: How can I improve my Walmart listing content quality score?
A: Walmart’s content quality score evaluates eight dimensions: title keyword density (75+ chars recommended), image count and quality (6-8 high-res lifestyle images), bullet point completeness (5 detailed bullets), attribute richness (70+ populated fields), Enhanced Content presence, video inclusion, reviews and ratings. Tools like Maxmerce’s Listing Insights show exactly which attributes you’re missing and benchmark your score against category leaders, prioritizing improvements by impact potential to optimize efficiently.
Q: What’s the fastest way to diagnose listing quality issues?
A: Start with Walmart’s Item Performance Report to identify red-flag metrics (conversion <3%, CTR <1.2%, content score <70). Then use analytics tools to drill down: check search term reports for keyword gaps, analyze competitor content completeness, review customer questions for missing information. Maxmerce’s Listing Insights automates this diagnosis, flagging specific optimization opportunities ranked by impact potential and providing actionable recommendations based on competitive analysis and category benchmarks.
Q: How often should I monitor my Walmart listing quality metrics?
A: Check your Listing Quality Dashboard weekly minimum for strategic monitoring, daily for active optimization campaigns. Key triggers for immediate review: sudden CTR drops (indicates search relevance issues), conversion rate decline (signals content or pricing problems), content score changes (Walmart updated requirements). Automated analytics platforms like Maxmerce provide real-time alerts when metrics cross critical thresholds, letting you respond before rankings suffer rather than discovering issues during weekly manual reviews.
Q: Can I optimize Walmart listings without manual daily checking?
A: Yes, through analytics automation. Platforms like Maxmerce’s Listing Insights monitor your dashboard 24/7, track metric trends, identify optimization opportunities, and alert you to issues requiring action. This reduces manual monitoring from 2-3 hours daily to 15-20 minutes reviewing prioritized recommendations. The system highlights which listings need attention and what specific changes will have the greatest impact on Polaris scoring, enabling efficient optimization at scale.
Q: What conversion rate should I target for good Walmart Buy Box performance?
A: Aim for 6-8% minimum conversion rate to stay competitive in most Walmart categories. Top-performing listings achieve 10-15% conversion through optimized content, competitive pricing, and strong social proof. Below 4% conversion signals serious issues—poor content quality, pricing misalignment, or product-market fit problems. Use comparative analytics to benchmark your conversion against category averages and identify realistic improvement targets based on competitive positioning and product characteristics.
Conclusion: From Walmart Listing Quality Dashboard Data to Revenue Growth
The Walmart listing quality dashboard isn’t just an analytics interface—it’s a direct communication channel from the Polaris algorithm telling you exactly how to improve your marketplace performance. Sellers who treat the Walmart listing quality dashboard as just another reporting tool struggle with inconsistent rankings and frustrated revenue goals. Those who decode the Walmart listing quality dashboard signals and optimize systematically dominate search results and capture disproportionate market share.
The fundamental insight: every metric in your Walmart listing quality dashboard directly influences Polaris ranking calculations. Conversion rate, content quality scores, search engagement signals—they’re not passive measurements, they’re active ranking inputs. Improve your Walmart listing quality dashboard metrics and rankings automatically follow. Let metrics degrade and visibility evaporates regardless of how great your products actually are.
Optimization at scale requires systematic processes, not heroic manual effort. Establish regular audit cadences, prioritize by impact potential rather than urgency, diagnose root causes before implementing fixes, measure results rigorously, and automate everything possible. This disciplined approach transforms listing quality management from an overwhelming operational burden into a sustainable competitive advantage.
For sellers managing large catalogs or multiple marketplaces, analytics automation shifts from nice-to-have to operational necessity. Manual tracking simply can’t maintain optimization discipline across hundreds of listings while also managing inventory, customer service, advertising, and business strategy. The math doesn’t work—something has to give, and usually it’s listing quality that gets neglected.
Ready to transform your Walmart listing quality management from reactive firefighting to proactive optimization? Start your 14-day free trial of Maxmerce Analytics—no credit card required. Connect your Walmart Seller Central account and get instant visibility into listing quality opportunities across your entire catalog, prioritized by revenue impact. See exactly which listings need attention and what specific optimizations will drive the biggest improvements.