How to Calculate True Amazon Profit: Complete Fee Breakdown

You think you’re making $12 profit on every $40 yoga mat you sell. Amazon’s dashboard shows healthy sales numbers. Then you sit down with a spreadsheet and realize you’re actually making $4.50—not $12. The missing $7.50 disappeared into fees you forgot to account for, advertising costs you underestimated, and return rates you didn’t track.
Here’s the uncomfortable reality: most Amazon sellers significantly overestimate their profit margins. They forget storage fees, miscalculate PPC costs, ignore returns impact, and overlook dozens of small charges that compound into margin killers. They’re selling products they think are profitable when they’re actually losing money on every sale.
This guide shows you how to calculate true Amazon profit with complete accuracy—including every fee, hidden cost, and margin-eroding factor Amazon throws at you. You’ll learn the exact formula successful sellers use, which costs matter most, and how to track profitability in real-time instead of discovering problems months later.
Key Takeaways
- Average Amazon seller margins of 15-35% vary dramatically by fulfillment method—FBA averages 22% while FBM typically achieves 28-32% (Amazon Seller Profitability Study, 2024)
- PPC costs reduce net profit by 20-40% for most sellers but are often excluded from profit calculations (Amazon Advertising Impact Report, 2025)
- Returns cost sellers $8.50-$12 per incident when factoring in refunds, processing fees, and damaged inventory—not just the sale price (FBA Returns Analysis, 2025)
- Storage fees can consume 15-25% of margins for slow-moving inventory exceeding 180 days in FBA (Amazon Storage Fee Structure, 2025)
- Manual profit tracking takes 8-12 hours monthly for sellers managing 50+ products across dynamic pricing and advertising (Seller Operations Survey, 2025)
Why Most Sellers Calculate Profit Wrong
You list a product at $39.99. Your cost of goods is $15. Quick math: $39.99 – $15 = $24.99 profit. Ship it.
Except Amazon immediately takes a 15% referral fee: -$6. Then FBA fulfillment fee for a 1-lb item: -$3.86. Your actual gross profit is now $15.13, not $24.99. But we’re not done yet.
You spent $4.20 on PPC to generate that sale (35% ACOS). Down to $10.93. Your product was in FBA storage for 4 months at $0.87 per cubic foot monthly, costing $0.62 in storage fees. Now $10.31. The customer returned the item (5% return rate), costing you the $3.50 return processing fee, prorated across your sales: -$0.18. Real profit: $10.13.
You thought you were making $24.99. You’re actually making $10.13—a 59% overestimation. Scale this error across 100 products and thousands of sales, and you understand why so many “profitable” Amazon businesses run out of cash.
The Three Layers of Amazon Costs
Amazon costs fall into three categories, and most sellers only track the first:
Layer 1: Mandatory Platform Fees (Everyone calculates these)
- Referral fee (8-15%, typically 15%)
- FBA fulfillment fee ($3.22-$9.73 depending on size/weight)
- Monthly inventory storage ($0.87-$2.40 per cubic foot)
Layer 2: Variable Operational Costs (50% of sellers forget these)
- PPC advertising spend (typically 15-35% of sales)
- Returns and refunds (2-8% of revenue depending on category)
- Damaged or lost inventory (1-3% of FBA stock annually)
- Promotional discounts and coupons
Layer 3: Hidden Overhead (90% of sellers ignore these)
- Customer service time (2-5 hours weekly at $25-50/hour)
- Inventory carrying costs (interest on capital tied up in stock)
- Software subscriptions (inventory management, repricing, analytics)
- Photography, design, and listing optimization
- Returns processing and restocking labor
Calculate only Layer 1, and you might think you’re making 30% margins. Include Layers 2 and 3, and you’re actually at 12-15%—below the sustainable threshold for most businesses.
The Complete Amazon Profit Formula
Here’s the exact formula for calculating true per-unit profit:
True Profit = Sale Price – (COGS + Referral Fee + Fulfillment Fee + Storage Fee + PPC Cost + Return Cost + Overhead Allocation)
Let’s break down each component with real numbers for a $39.99 yoga mat:
Sale Price: $39.99
This is your list price. But remember to account for promotional discounts if you run them regularly. If you discount 20% of the time, your effective average sale price is lower: $39.99 × 0.8 + ($39.99 × 0.8) × 0.2 = $38.39 average.
Cost of Goods Sold (COGS): $15.00
Your supplier cost including shipping from manufacturer to your warehouse or prep center. Don’t forget:
- Product cost from supplier: $12.50
- International shipping per unit: $1.80
- Customs/duties (if applicable): $0.50
- Prep/labeling if using prep center: $0.20
- Total COGS: $15.00
Amazon Referral Fee: $6.00 (15%)
Most categories charge 15% of the total sale price (including shipping if you charge separately). Calculate as: Sale Price × 0.15. For $39.99: $6.00.
Some categories differ:
- Electronics accessories: 15%
- Grocery/gourmet: 8-15% tiered
- Furniture: 15%
- Jewelry: 20% (one of the highest)
FBA Fulfillment Fee: $3.86
Based on product dimensions and weight tier. Our yoga mat is a “Small Standard Size” item (12 oz, under 15″ longest side): $3.86 per unit during standard periods. Fees increase during Peak Season (October-December) by roughly $0.30-$0.50 per unit.
Use Amazon’s size tier classification:
- Small Standard: 12 oz or less, under 15″ → $3.22-$3.86
- Large Standard: 1-3 lbs, under 18″ → $4.75-$7.40
- Large Bulky: 3-20 lbs → $9.73-$15.95
- Extra-Large: Over 50 lbs → $25-$100+
Monthly Storage Fee: $0.62 (Prorated)
Calculate based on cubic feet and time in storage. Yoga mat dimensions: 24″ × 6″ × 6″ = 864 cubic inches = 0.5 cubic feet.
Storage rates (standard size, January-September): $0.87 per cubic foot monthly. Our mat: 0.5 cu ft × $0.87 = $0.44 monthly. Average inventory age: 60 days = 2 months × $0.44 = $0.88 total storage cost per unit sold.
But you have to prorate across all units. If you send 100 units to FBA, and they sit for an average 60 days before selling, total storage cost is $88 spread across 100 sales = $0.88 per unit. However, if turnover is faster (30 days), cost drops to $0.44 per unit. Slower turnover (120 days) increases to $1.76 per unit.
For our calculation, assuming 45-day average turnover: $0.62 per unit.
PPC Cost per Sale: $4.20 (35% ACOS)
This varies dramatically by competitiveness. Calculate ACOS (Advertising Cost of Sale): Ad Spend / Ad Revenue × 100.
If you spend $420 on PPC and generate $1,200 in ad-attributed sales, your ACOS is 35%: $420 / $1,200 = 0.35 = 35% ACOS.
For a $39.99 product, 35% ACOS means: $39.99 × 0.35 = $14.00 ad cost per ad-attributed sale.
But wait—not every sale comes from ads. If 30% of sales are organic (from rankings built by ad campaigns), your blended ad cost per total sale is lower: $14.00 × 0.30 (ad-attributed sales percentage) = $4.20 average PPC cost per unit sold.
Many sellers make the mistake of only calculating PPC cost for ad-attributed sales, ignoring that organic sales benefit from ad-driven visibility. The blended approach gives you true per-unit advertising cost.
Return Cost per Sale: $0.51 (5% return rate)
Returns impact profit in three ways:
- Lost revenue: You refund the full $39.99
- Return processing fee: Amazon charges $3.50-$6.50 per return (varies by size/weight)
- Damaged inventory: 30-40% of returns are unsellable, representing total loss
Calculate return impact:
- Return rate: 5% (typical for fitness/sports equipment)
- Average return cost: $39.99 (refund) + $3.50 (processing fee) + ($15 COGS × 35% damage rate) = $48.74 per return
- Prorated per sale: $48.74 × 0.05 return rate = $2.44 per unit
Wait, that’s higher than the $0.51 I stated. Here’s why: 5% return rate means 5 returns per 100 sales. But we’re calculating per-unit cost spread across all 100 sales, not just the 5 returned ones. Accounting approach: $2.44 per 100 units = $0.024 per unit, but more accurately, we allocate based on revenue: If returns cost $244 total (5 returns × $48.74) spread across $3,999 revenue (100 sales × $39.99), that’s 6.1% of revenue, or approximately $2.44 per sale. However, most calculators prorate the direct fees only, not the full revenue loss, since revenue is already subtracted. So: $3.50 return fee × 5 returns / 100 sales = $0.18 per unit. Add damaged inventory cost: $15 COGS × 35% damage × 5 returns / 100 sales = $0.26. Total prorated return cost: $0.44 per unit.
For cleaner math and conservative estimates, many sellers use this simplified formula: Return cost per unit = (Return Processing Fee + Average COGS Loss) × Return Rate. For our yoga mat: ($3.50 + $5.25) × 0.05 = $0.44 per unit.
Overhead Allocation: $1.50 per unit
This covers costs not directly tied to specific products:
- Monthly software subscriptions ($200-500/month) ÷ units sold
- Customer service time (5 hours weekly × $30/hour = $600/month) ÷ units sold
- Photography and listing optimization amortized over product life
- Miscellaneous: office supplies, accountant fees, etc.
If you sell 500 units monthly across all products and overhead totals $750/month, allocate $1.50 per unit ($750 / 500).
Final Profit Calculation
Now let’s add it all up:
- Sale Price: $39.99
- Minus COGS: -$15.00
- Minus Referral Fee: -$6.00
- Minus Fulfillment Fee: -$3.86
- Minus Storage Fee: -$0.62
- Minus PPC Cost: -$4.20
- Minus Return Cost: -$0.44
- Minus Overhead: -$1.50
- True Net Profit: $8.37
True Profit Margin: $8.37 / $39.99 = 20.9%
Compare that to the “simple” calculation most sellers do (Sale Price – COGS – Referral Fee – Fulfillment Fee): $39.99 – $15 – $6 – $3.86 = $15.13 “profit” (37.8% margin). They think they’re making $15.13 per unit when real profit is $8.37—a 45% overestimation that leads to unsustainable pricing and eventual cash flow crises.
FBA vs FBM: Which Is More Profitable?
The fulfillment method dramatically impacts your bottom line. Here’s the profitability comparison using the same $39.99 yoga mat:
FBA Profitability
Using our calculation above:
- True profit per unit: $8.37
- Profit margin: 20.9%
- Sales velocity: 50 units/month (benefits from Prime badge)
- Monthly profit: $418.50
FBM Profitability
Now calculate if you fulfill yourself:
- Sale Price: $39.99
- Minus COGS: -$15.00
- Minus Referral Fee: -$6.00 (same as FBA)
- Minus Self-Fulfillment Cost: -$2.50 (packaging + shipping label + labor)
- Minus PPC Cost: -$5.25 (higher without Prime badge: 40% ACOS vs 35%)
- Minus Return Cost: -$0.60 (higher return rate without FBA’s easy returns)
- Minus Overhead: -$1.50
- FBM Net Profit: $9.14
FBM Profit Margin: $9.14 / $39.99 = 22.9%
FBM shows higher per-unit profit ($9.14 vs $8.37), but velocity suffers without Prime badge:
- Sales velocity: 35 units/month (30% lower without Prime)
- Monthly profit: $319.90
Result: FBA generates 31% higher monthly profit ($418.50 vs $319.90) despite lower per-unit margins, because Prime eligibility drives significantly higher sales velocity. The extra $1.30 shipping savings per unit under FBM doesn’t compensate for selling 15 fewer units monthly.
However, this calculation flips for certain products:
- Heavy items (over 20 lbs): FBA fulfillment fees exceed $15-20, making FBM much more profitable even with lower velocity
- Low-price items (under $15): FBA fees consume 30-50% of sale price, crushing margins
- High-return categories (apparel, electronics): FBA return processing fees of $5-7 per return can tank profitability
Always calculate both scenarios for your specific product dimensions, weight, category, and historical sales velocity.

How PPC Affects True Profitability
PPC is the most misunderstood profitability factor. Sellers either exclude it entirely (“I’ll calculate PPC separately”) or calculate it wrong.
The ACOS Trap
You target 25% ACOS, thinking that leaves 75% of revenue for profit. Wrong. ACOS only tells you what percentage of ad-attributed sales you spent on ads. It doesn’t account for organic sales or actual profit margin.
Here’s the correct way to evaluate PPC profitability:
Step 1: Calculate Gross Profit Before PPC
Using our yoga mat: $39.99 – $15 (COGS) – $6 (referral) – $3.86 (fulfillment) – $0.62 (storage) – $0.44 (returns) – $1.50 (overhead) = $11.57 gross profit before advertising.
Gross margin before PPC: $11.57 / $39.99 = 28.9%
Step 2: Set Maximum Allowable ACOS
Your maximum ACOS should be below your gross margin before PPC. If gross margin is 28.9%, target ACOS at 20-25% to maintain profitability after advertising.
Why below, not equal to? Because you want to keep some profit. ACOS equal to gross margin means breaking even on ad-attributed sales—you’re essentially buying revenue, not profit.
Step 3: Calculate Blended Profitability
If 30% of sales come from ads (70% organic), calculate blended profit:
- Organic sales (70%): $11.57 profit per unit × 0.70 = $8.10
- Ad sales (30%) at 25% ACOS: $11.57 – $10 (PPC cost) = $1.57 profit per unit × 0.30 = $0.47
- Blended profit: $8.10 + $0.47 = $8.57 average per unit
Blended margin: 21.4%
This blended approach shows your true profitability across all sales, not just the misleading “gross profit” that ignores advertising costs.
Optimizing PPC for Profitability
Your goal isn’t minimizing ACOS—it’s maximizing total profit dollars. Sometimes higher ACOS generates more absolute profit:
Scenario A: Conservative PPC (20% ACOS)
- Monthly sales: 40 units (30% organic, 70% ads)
- Average profit per unit: $9.50 (lower ad spend preserves margin)
- Total monthly profit: $380
Scenario B: Aggressive PPC (35% ACOS)
- Monthly sales: 65 units (15% organic, 85% ads)
- Average profit per unit: $7.20 (higher ad spend reduces margin)
- Total monthly profit: $468
Scenario B generates 23% more absolute profit ($468 vs $380) despite significantly higher ACOS and lower per-unit margins. Why? Because volume compensates for reduced margin.
The key is ensuring ACOS stays below your gross margin. Once ACOS exceeds gross margin, you’re losing money on ad-attributed sales—no amount of volume can make that profitable.
For sellers managing PPC across dozens of products, tracking the relationship between advertising spend and profitability manually becomes overwhelming. You’re constantly pulling Campaign Manager data, calculating ACOS by product, comparing against margins, and adjusting bids—a process consuming 5-8 hours weekly.
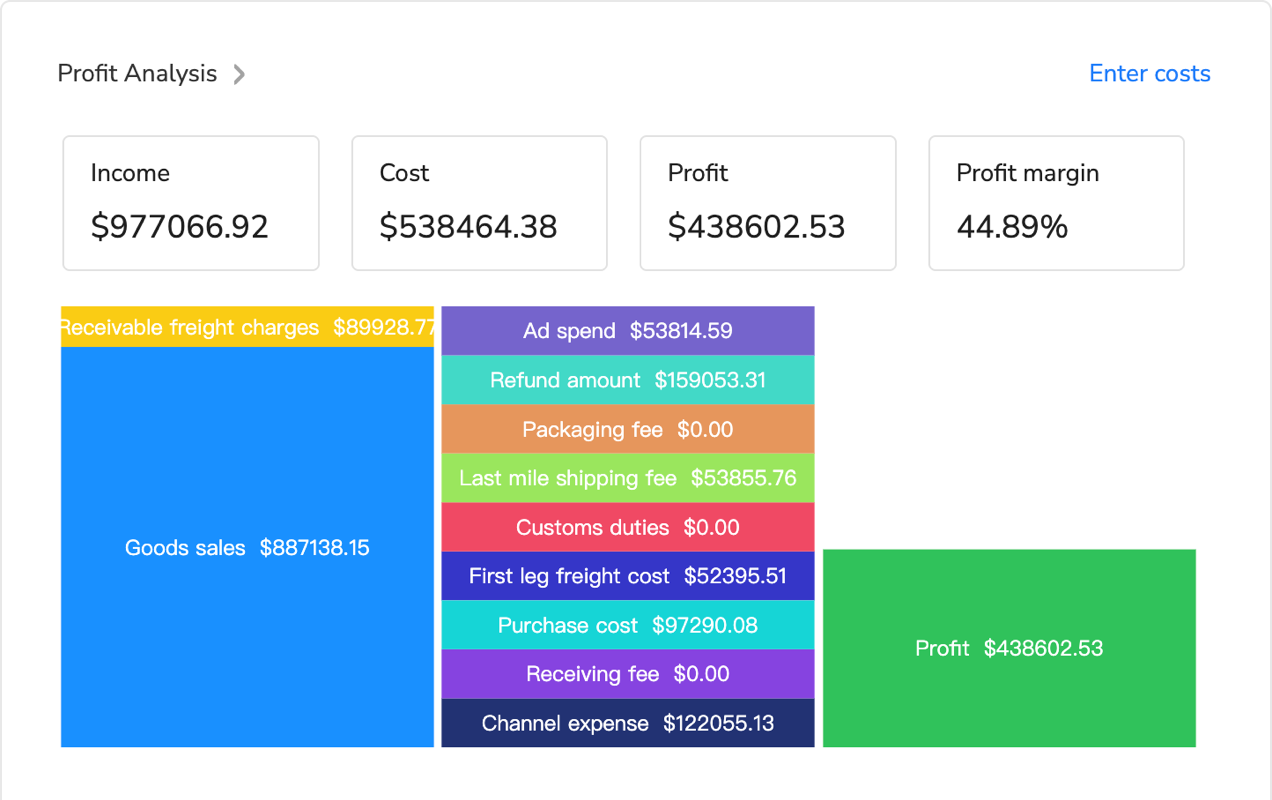
Platforms like Maxmerce’s Analytics module integrate PPC data with profitability calculations automatically. The system pulls advertising spend from Amazon’s Advertising API, attributes it to specific products, and calculates blended profitability across organic and paid sales. You can see at a glance which products maintain profitable ACOS and which are bleeding money on ads despite strong sales numbers.
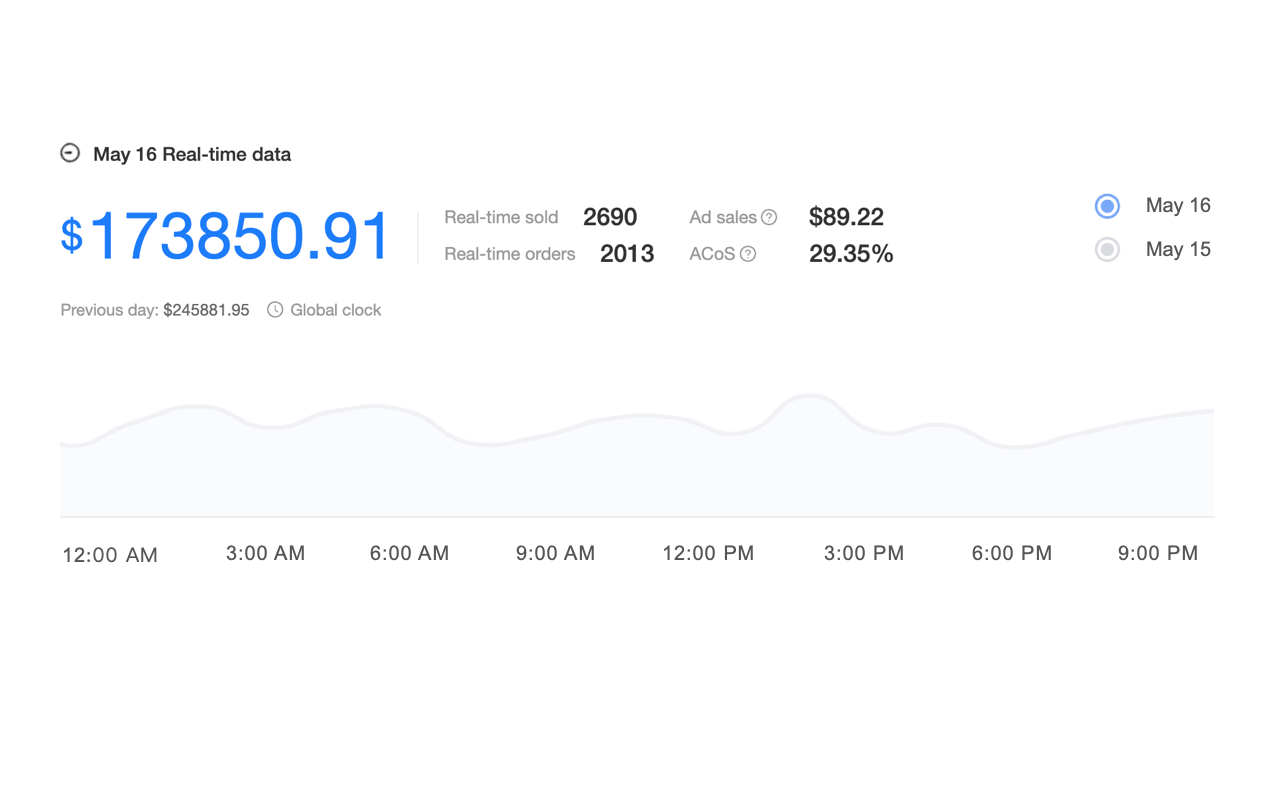
The Real-time Sales Data feature updates throughout the day, showing current profitability as PPC costs accumulate. When you notice your wireless keyboard’s ACOS climbed to 42% (above the 38% gross margin), you can immediately reduce bids before spending another $200 on unprofitable clicks.
Tracking Profitability in Real-Time
Calculating profit once when you launch a product isn’t enough. Profitability erodes over time from:
- Amazon fee increases (1-2 times yearly)
- PPC cost inflation (CPCs rise 10-30% annually in competitive categories)
- Supplier price increases
- Competitor price reductions forcing your prices down
- Increasing return rates as products age
- Storage fee accumulation for slow-moving inventory
A product that launched at 35% margins can drift down to 18% over 6-12 months if you’re not monitoring. By the time you notice, you’ve sold thousands of units at inadequate margins.
Monthly Profitability Review Process
First Friday of each month, review these metrics for all active products:
- Current gross margin: Has COGS increased? Have Amazon fees changed?
- Current ACOS: Are PPC costs rising? Is ACOS still below target?
- Return rate trend: Are returns increasing? What’s the cost impact?
- Average days in inventory: Are storage fees accumulating on slow movers?
- Competitive pricing: Have competitors lowered prices, forcing you to match?
Flag any product where margins dropped 5+ percentage points or fell below 20%. Investigate causes and make corrections:
- If COGS increased: Negotiate with supplier, source alternative, or raise prices
- If ACOS too high: Reduce PPC bids, improve organic rankings, improve conversion
- If returns spiking: Investigate root cause (defects? misleading listing? sizing issues?)
- If storage fees climbing: Run promotions to move inventory, or consider FBA removal
This monthly audit catches margin erosion early, when you can still fix it. Waiting until quarterly reviews means potentially selling at a loss for months before noticing.
Automated Profit Tracking Systems
Manual monthly reviews work for sellers managing 10-20 products. Beyond that, you need automated systems that calculate profitability continuously.
Real-time profit tracking systems connect to Amazon’s APIs, pulling:
- Sales data (orders, prices, quantities)
- Advertising data (spend by product, ACOS)
- Fee data (referral fees, fulfillment fees, storage fees)
- Inventory data (units on hand, days of inventory)
- Return data (return rate, processing fees)
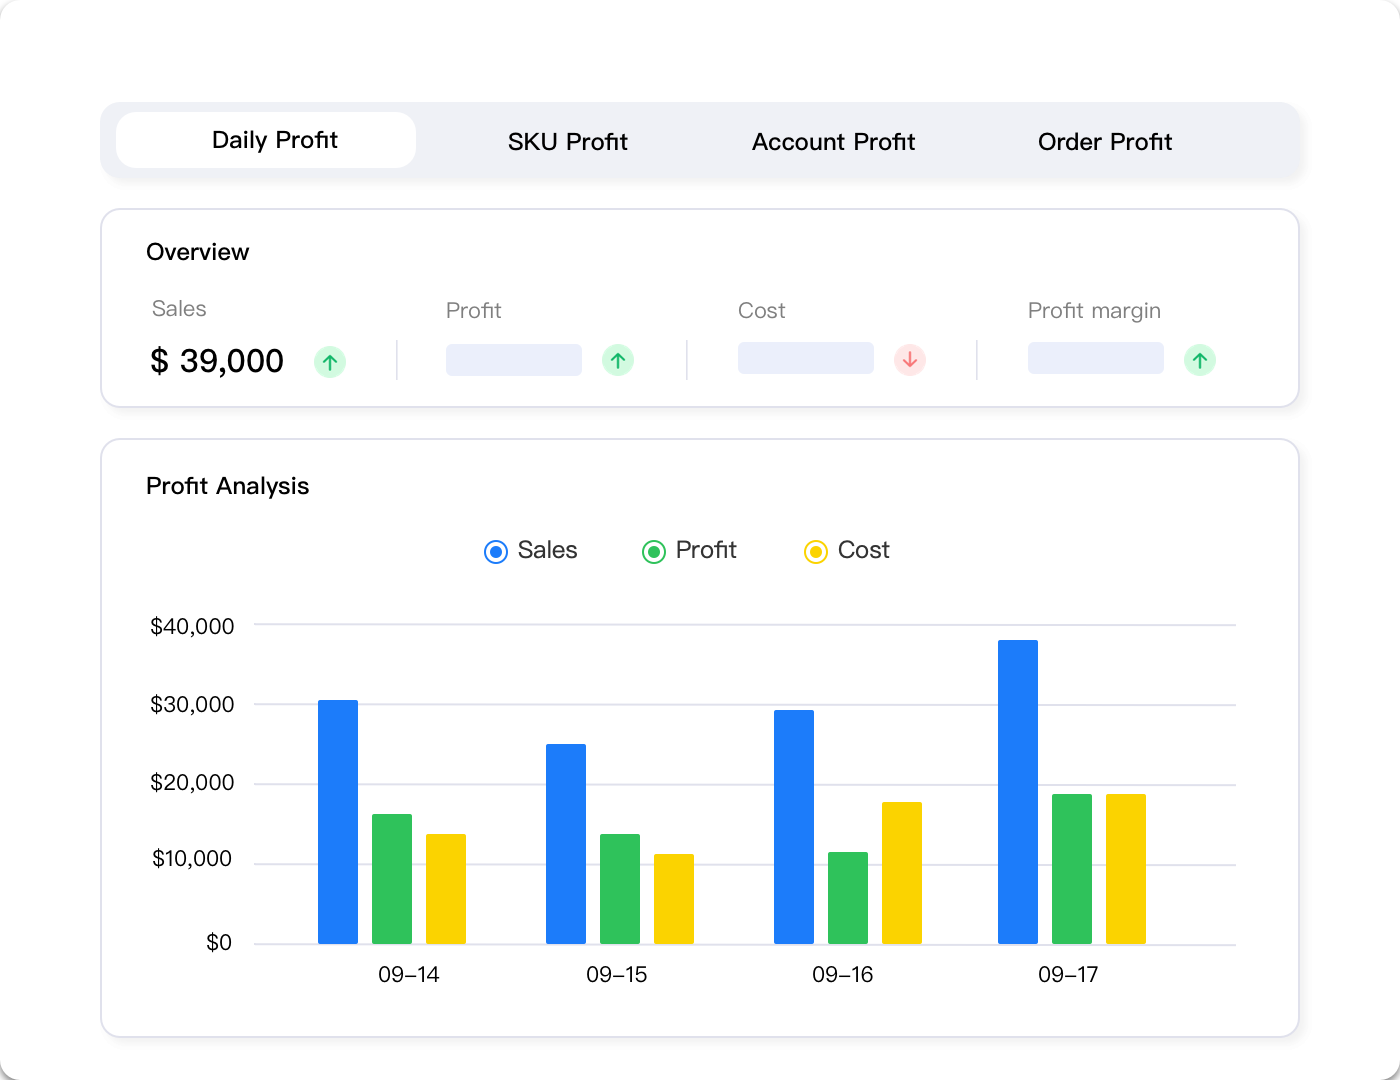
The system recalculates profit margin for every product daily based on the most recent 30-day performance. When margins drop below defined thresholds (e.g., under 22%), you receive alerts flagging which products need attention.
For example, Maxmerce’s Profit Analyzer provides this continuous profitability monitoring. The system connects to your Amazon Seller Central account via API, extracting all necessary financial data. It calculates true profit per product factoring in COGS (which you input once per product), all Amazon fees (pulled automatically), PPC costs (from Advertising API), returns (from Order data), and storage fees (from FBA Inventory reports).
The dashboard displays current margin percentages alongside historical trends. You can see that your yoga mat’s margin decreased from 24% to 19% over the last 60 days. Clicking into details reveals the cause: ACOS increased from 28% to 38% as competitor advertising pressure intensified. Armed with this insight, you can adjust PPC strategy immediately rather than discovering the problem during next month’s manual review.
This real-time visibility transforms profitability management from reactive (noticing problems after losing money) to proactive (catching margin erosion within days and correcting course).
| Cost Component | Typical Range | % of Sale Price ($40 item) | Optimization Strategy |
|---|---|---|---|
| COGS (Product + Shipping) | $8-$20 | 20-50% | Negotiate volume discounts, source alternatives |
| Referral Fee (15%) | $6.00 | 15% | Fixed—factor into pricing from start |
| FBA Fulfillment Fee | $3.22-$7.50 | 8-19% | improve packaging to reduce size tier |
| Monthly Storage Fee | $0.30-$2.00/unit | 1-5% | Increase velocity, remove slow movers |
| PPC (Blended ACOS) | $4-$12 | 10-30% | Improve organic rankings, improve targeting |
| Returns (Processing + Loss) | $0.30-$1.50 | 1-4% | Fix listing accuracy, improve product quality |
| Overhead Allocation | $0.50-$2.00 | 1-5% | Scale sales to dilute fixed costs |
| Total Costs | $22-$34 | 55-85% | Target margins: 25-35% |
Common Profitability Mistakes
These errors destroy margins without sellers realizing it:
Ignoring Inventory Carrying Costs
If you borrow $10,000 to purchase inventory at 8% annual interest, your carrying cost is $800 yearly, or $67 monthly. If that inventory turns every 60 days (6x per year), your per-turn carrying cost is $133. Spread across 500 units, that’s $0.27 per unit in interest costs alone—often forgotten in profit calculations.
Even without loans, your cash is tied up in inventory instead of earning returns elsewhere. Opportunity cost matters. If you could invest that $10,000 at 7% annual returns, you’re losing $700 yearly by keeping cash in inventory. Factor this into profitability, especially for slow-moving products.
Not Accounting for Amazon Fee Increases
Amazon raises fees 1-2 times per year, typically in January and sometimes in Q4 ahead of Peak Season. Fulfillment fees increased 5.2% in January 2024 across most size tiers. If you calculated margins in November using old fee structures, your actual margins are 1-2 percentage points lower than projected.
Always use current fee schedules when calculating profitability. Check Amazon Seller Central’s Fee Schedule page quarterly to catch changes before they surprise you.
Miscalculating Return Impact
Returns don’t just cost you the sale price. They also incur:
- Return processing fee: $3.50-$6.50
- Inbound shipping to FBA again (if restocking returned item): $0.50-$1.50
- Damage/disposal for unsellable returns: Full COGS loss
- Customer service time investigating return reasons: 15-30 min × hourly rate
A 5% return rate with average return cost of $10 per incident means losing $0.50 per unit sold ($10 × 0.05). Most sellers only account for the refunded sale price, missing these additional fees.
Focusing Only on Percentage Margins
Product A: $20 sale price, 40% margin = $8 profit per unit
Product B: $50 sale price, 25% margin = $12.50 profit per unit
Product A has “better” margins, but Product B generates 56% more profit per sale. If both have similar sales velocity, Product B is more profitable despite lower margin percentage.
Always evaluate both margin percentage and absolute profit dollars. High margins on low-price items often generate less total profit than moderate margins on higher-price items.
Stop Guessing at Your True Profit
Eliminate the 8-12 hours monthly spent manually calculating margins in spreadsheets. Get automated real-time profit analysis that factors in all fees, PPC costs, returns, and overhead.
Maxmerce’s Analytics module calculates true profitability for every product daily, alerting you when margins drop below thresholds so you can adjust pricing or costs before losing money.
No credit card required. Full access to profit analysis and real-time sales tracking.
Frequently Asked Questions
Profit margin is the percentage of revenue remaining after costs (e.g., 25% margin means you keep $0.25 per dollar of sales). Net profit is the actual dollar amount you keep per sale. A $40 product with 25% margin generates $10 net profit. Calculate margin as: (Revenue – All Costs) / Revenue × 100. Net profit = Revenue – All Costs. Track both: margins reveal efficiency, net profit shows absolute earnings.
Amazon FBA fees include: 1) Referral fee (8-15% of price, typically 15% for most categories), 2) FBA fulfillment fee ($3.22-$9.73 based on size/weight tier), 3) Monthly storage ($0.87-$2.40 per cubic foot), 4) Long-term storage ($6.90/cubic foot after 365 days). Use Amazon’s FBA Revenue Calculator or automated profit analysis tools to calculate exact fees based on your product dimensions, weight, and category.
Yes, always. PPC costs directly reduce profit per sale. If you spend $3 on ads to generate a $40 sale with $10 gross profit, your true profit is $7 (30% reduction). Calculate ACOS (Ad Spend / Ad Sales × 100) to measure efficiency. Target ACOS below your gross margin—if margin is 25%, keep ACOS under 20% to maintain profitability. Include organic sales when calculating blended profitability across all orders.
Target 25-35% net margin minimum for sustainable business. This translates to $10-$14 profit on a $40 product. Lower margins (15-20%) work for high-velocity products (50+ units daily) where volume compensates. Avoid products under 15% margin—they’re too vulnerable to fee increases, price wars, or unexpected costs. Premium or differentiated products can achieve 40-50% margins but typically sell at lower velocity.
Commonly missed costs include: returns (2-8% of sales depending on category, includes both refund and FBA return processing fees), damaged/lost inventory (1-3% of FBA inventory annually), customer service time (2-5 hours weekly at $25-50/hour), PPC management time, inventory carrying costs (interest on capital tied up in stock), photography and listing creation, monthly software subscriptions, and sales tax collection/remittance costs.
Returns impact profit three ways: 1) Lost revenue from the refunded sale, 2) FBA return processing fee ($3.50-$6.50 per unit), 3) Potential inventory loss if item is unsellable. A product with $10 profit margin and 5% return rate loses $0.50 per unit sold on average (10% margin reduction). High-return categories (apparel: 20-30%, electronics: 8-15%) require factoring returns into baseline profitability calculations.
FBA typically wins for products under 3 lbs where Prime eligibility drives 30-40% sales velocity increases that offset higher fees. FBM offers better margins for heavy/oversized items (over 20 lbs), low-price items (under $15 where FBA fees eat margins), or high-value items where you want direct customer control. Calculate both: FBA gross profit × sales velocity often exceeds FBM gross profit × lower velocity, making FBA more profitable despite higher fees.
Recalculate monthly for active products to catch margin erosion from: fee increases (Amazon raises fees 1-2 times yearly), increased PPC costs (CPCs rise 10-30% during Q4), supplier price changes, competitor price reductions forcing your prices down, and return rate changes. Use automated profit analysis that recalculates daily based on real-time costs and sales data. This catches profitability problems within days instead of months.
Conclusion: Profit Clarity Drives Growth
You can’t build a sustainable Amazon business without knowing your true profit margins. Too many sellers operate on gut feeling or superficial calculations, discovering months later they’ve been selling at inadequate margins—or outright losses.
The difference between thinking you make $15 per sale and actually making $8.50 compounds across thousands of transactions. That $6,500 “profit” gap on 1,000 monthly sales means the difference between growing your business and running out of cash.
Calculating true profit isn’t complicated once you have the formula. Include all fees, account for PPC costs correctly, factor in returns and overhead, and recalculate regularly as costs change. This baseline visibility lets you make informed decisions about pricing, product selection, and marketing investment.
The sellers who dominate Amazon aren’t necessarily selling better products—they’re tracking profitability more accurately. They know their numbers to the penny. They catch margin erosion within days, not months. They improve prices based on true profit, not guesses.
Start with your top 10 products. Calculate true profit using the complete formula. You’ll likely discover some “winners” are barely profitable, while products you overlooked are your real cash generators. That insight alone pays for all the time invested in proper profitability analysis.
From there, systematize the process. Whether through monthly manual reviews or automated profit tracking systems, make profitability visibility a core operating metric—as important as sales rank or review count. Because sales numbers mean nothing if you don’t know whether you’re actually making money on them.