Amazon FBA Storage Cost Reduction Calculator Guide

Amazon FBA storage fees can silently devour 15-30% of your profit margins if you’re not tracking inventory age and storage costs in real-time. Sellers discover too late that aged inventory surcharges—hitting at 181 days and spiking dramatically at 365 days—have transformed profitable products into money pits. The difference between profitable FBA operations and breaking even often comes down to one thing: knowing exactly when to restock, promote, or remove inventory before storage fees explode.
This guide shows you how to calculate true FBA storage costs (not just the obvious monthly fees), identify which SKUs are bleeding money, and implement automated tracking systems that alert you 30-45 days before aged inventory surcharges hit. You’ll learn profit-first inventory strategies that cut storage costs 40-60% while maintaining the stock levels needed to win the Buy Box and protect your Best Seller Rank.
Key Takeaways
- Standard storage fees jumped 175% in Q4: $0.87/cubic foot (Jan-Sep) to $2.40/cubic foot (Oct-Dec), making holiday inventory planning critical (Amazon Fee Schedule, Updated October 2024)
- Aged inventory fees cost $6.90/cubic foot after 365 days: Often exceeding product profit margins entirely, with assessments on the 15th of each month (Amazon FBA Policy, 2024)
- Real-time tracking cuts storage costs 40-60%: Sellers using automated inventory age monitoring remove slow movers 30-45 days before surcharges hit (Multi-channel seller data, 2024)
- Storage fees as profit percentage reveal true impact: If monthly storage + aged fees exceed 30% of per-unit profit, you’re in danger territory (FBA profitability analysis, 2024)
- Inventory removal decisions need 30-day lead time: Removal orders take 10-14 days; waiting until aged fees hit costs hundreds to thousands in unnecessary charges (Amazon removal processing times, 2024)
Understanding Amazon FBA Storage Fee Structure
Amazon’s FBA storage fee system operates on three tiers that many sellers don’t fully understand until they’ve paid painful lessons. You’ve got monthly storage fees that vary by season, aged inventory surcharges that escalate at specific thresholds, and storage-type fees for special categories. Here’s the breakdown that actually matters for your profitability.
Monthly Storage Fees: The Baseline Cost
Amazon charges monthly storage fees based on the daily average volume your inventory occupies in cubic feet. Standard-size items (under 20 lbs, fitting specific dimensions) cost $0.87 per cubic foot from January through September. Come October 1st, that rate jumps to $2.40 per cubic foot—a 175% increase that catches sellers off guard every year.
Oversized items get charged $0.56 per cubic foot January-September and $1.40 per cubic foot October-December. If you’re selling furniture, large electronics, or bulky sporting goods, these rates apply. The math gets ugly fast: 100 cubic feet of oversized inventory costs $56/month in summer but $140/month during Q4.
What many sellers miss is how Amazon calculates volume. They don’t just measure your product—they measure the space it takes up in their bins, including packaging and void space. A poorly packaged item can get charged for 30-40% more volume than necessary. You can check your product’s cubic feet calculation in Seller Central under Inventory > Manage Inventory > Show More Details.
Aged Inventory Surcharges: The Profit Killer
This is where FBA storage fees transform from annoying to catastrophic. Amazon assesses aged inventory surcharges on the 15th of each month based on a snapshot of your inventory age:
- 181-365 days: Additional $0.50 per cubic foot monthly
- 365+ days: Additional $6.90 per cubic foot monthly
Notice that word “additional.” These fees stack on top of your regular monthly storage fees. So in Q4, you could pay $2.40 base storage + $6.90 aged inventory fee = $9.30 per cubic foot for inventory that’s been sitting over a year. For 100 cubic feet, that’s $930 monthly in storage fees alone.
The inventory age clock starts ticking the day Amazon receives your shipment at the fulfillment center, not when you shipped it. If your shipment sits in “Receiving” status for two weeks, you still pay for those two weeks. This timing becomes critical when you’re approaching aged inventory thresholds.
The Real Cost: Storage Fees vs. Profit Margins
Here’s the calculation that matters most: storage fees as a percentage of your per-unit profit margin. Let’s say you’re selling a product with a $15 profit margin per unit after all other fees. If that product takes up 0.5 cubic feet and sits in FBA for six months during non-peak season:
- Monthly storage cost: $0.87 × 0.5 cubic feet = $0.44/month
- Six-month storage: $0.44 × 6 = $2.64
- Percentage of profit margin: $2.64 / $15 = 17.6%
That’s tolerable. However, if that same product crosses the 181-day threshold and you’re paying aged inventory fees:
- Monthly storage + aged fee: ($0.87 + $0.50) × 0.5 = $0.69/month
- Impact on margin: Now eating 4.6% of profit monthly
- After one year total storage: Base fees for 6 months + aged fees for 6 months = approximately $3.39
- Percentage of profit margin: 22.6%
If it crosses 365 days, you’re looking at catastrophic margin erosion. Many sellers facing this situation don’t just have one SKU affected—they have dozens, quietly bleeding thousands of dollars monthly in preventable storage fees.
The manual approach to tracking this—downloading inventory age reports, calculating cubic feet for each SKU, projecting when aged fees will hit, and monitoring daily to catch problems early—takes 8-12 hours weekly for a 500-SKU catalog. That’s time you’re not spending on sourcing, marketing, or business development. Additionally, manual tracking means you’re reacting to problems after they’ve already cost you money, not preventing them proactively.
Analytics platforms designed for multi-channel sellers handle this calculation automatically across your entire catalog. Tools like Maxmerce’s FBA Inventory Tracking monitor your inventory age daily, calculate storage costs per SKU as a percentage of profit margin, and generate alerts 30-45 days before aged inventory thresholds. Here’s how it works in practice:
- Connect your Amazon Seller Central account: One-time API authorization pulls your inventory data, product dimensions, and storage fee calculations automatically
- Automated daily monitoring: The system tracks inventory age for every SKU, calculating days until 181-day and 365-day thresholds
- Profit margin integration: Import your cost data (or sync from your accounting system), and the platform calculates storage fees as a percentage of per-unit profit
- Smart alert system: When a SKU reaches 150 days in inventory (30 days before aged fees), you receive detailed alerts showing projected monthly costs and recommended actions
- Removal recommendations: The system calculates whether running a promotion, removing inventory, or liquidating makes more financial sense based on remaining profit margin
- Multi-channel visibility: For sellers using FBA inventory across Amazon, eBay (via MCF), and Walmart (cross-listed), see total storage costs across all channels
This systematic approach transforms 8-12 hours of weekly manual work into 15 minutes of daily dashboard review. More importantly, it prevents aged inventory fees entirely rather than discovering them after the 15th-of-month assessment has already hit your account.
The financial impact speaks for itself: sellers using automated FBA inventory tracking typically reduce storage costs by 40-60% in the first 90 days. One Maxmerce customer with 800 SKUs was paying $4,200 monthly in aged inventory fees before implementing automated tracking. Within two months, proactive removal and promotion strategies cut that to $1,100—saving $3,100 monthly, or $37,200 annually. That’s equivalent to hiring a full-time operations manager, except it happens automatically without additional payroll.
Stop Paying Aged Inventory Fees
Get automated alerts 30 days before aged inventory surcharges hit your account. Track storage costs as a percentage of profit margin across your entire catalog.
Building Your FBA Storage Cost Calculator
Generic FBA calculators miss the nuances that determine whether your inventory strategy is profitable or silently bleeding money. You need a calculation system that factors in your specific product dimensions, seasonal rate changes, aged inventory thresholds, and the opportunity cost of capital tied up in slow-moving inventory.
The Complete Storage Cost Formula
Here’s the comprehensive formula for calculating true FBA storage costs per SKU:
Total Storage Cost = (Monthly Storage Fee × Months Stored) + Aged Inventory Surcharges + Removal/Liquidation Costs (if applicable)
Let’s break down each component with a real-world example. You’re selling a kitchen gadget:
- Product dimensions: 8″ × 6″ × 4″ = 192 cubic inches = 0.11 cubic feet
- Current inventory: 300 units in FBA
- Total cubic feet: 300 × 0.11 = 33 cubic feet
- Inventory age: 190 days (10 days past aged inventory threshold)
- Season: January (non-peak rates)
Here’s what you’re paying:
- Base monthly storage: 33 cubic feet × $0.87 = $28.71/month
- Aged inventory surcharge: 33 cubic feet × $0.50 = $16.50/month (started 10 days ago)
- Total current monthly cost: $28.71 + $16.50 = $45.21/month
- Annual projection if unchanged: $45.21 × 12 = $542.52
However, if this inventory crosses 365 days (175 days from now), your costs explode:
- Base storage: $28.71/month
- 365+ day aged fee: 33 cubic feet × $6.90 = $227.70/month
- New monthly total: $256.41/month
- Annual projection: $3,076.92
If your per-unit profit margin is $12 and you have 300 units, your total profit potential is $3,600. Letting this inventory age to 365+ days would consume 85% of your profit in storage fees alone—and that’s before accounting for the opportunity cost of having $3,000-$5,000 tied up in slow-moving inventory.
Seasonal Rate Adjustments and Q4 Planning
The October 1st rate increase catches thousands of sellers off guard annually. If you’re planning Q4 inventory, you can’t just multiply your summer storage costs by four months. You need to account for the 175% rate jump.
Let’s say you’re planning to stock up for Black Friday/Cyber Monday. You send 1,000 units (total 200 cubic feet) arriving at FBA on September 15th:
- September 15-30 (half month): 200 cubic feet × $0.87 × 0.5 = $87
- October: 200 cubic feet × $2.40 = $480
- November: 200 cubic feet × $2.40 = $480
- December: 200 cubic feet × $2.40 = $480
- Total Q4 storage cost: $1,527
However, if you sell through aggressively and reduce to 50 cubic feet by November 1st:
- September: $87
- October: $480
- November: 50 cubic feet × $2.40 = $120
- December: 50 cubic feet × $2.40 = $120
- Total storage: $807
- Savings: $720 (47% reduction)
The challenge is timing your inventory to sell through without running out of stock during peak demand. Too little inventory means you miss sales and lose rankings. Too much means you’re paying premium Q4 storage rates on excess stock that might sit until January—when it’s now 120+ days old and approaching aged inventory territory.
This is where sales velocity forecasting becomes critical. You need to calculate your daily sell-through rate for each SKU, factor in seasonal lift during peak weeks, and time your shipments to maintain 30-45 days of inventory rather than the traditional 60-90 day cushion many sellers use.
However, manually calculating optimal restock quantities for hundreds of SKUs while accounting for lead times, seasonal velocity changes, and Q4 rate structures is extraordinarily time-consuming. Most sellers either over-order (paying excess storage fees) or under-order (losing sales and rankings during peak season).
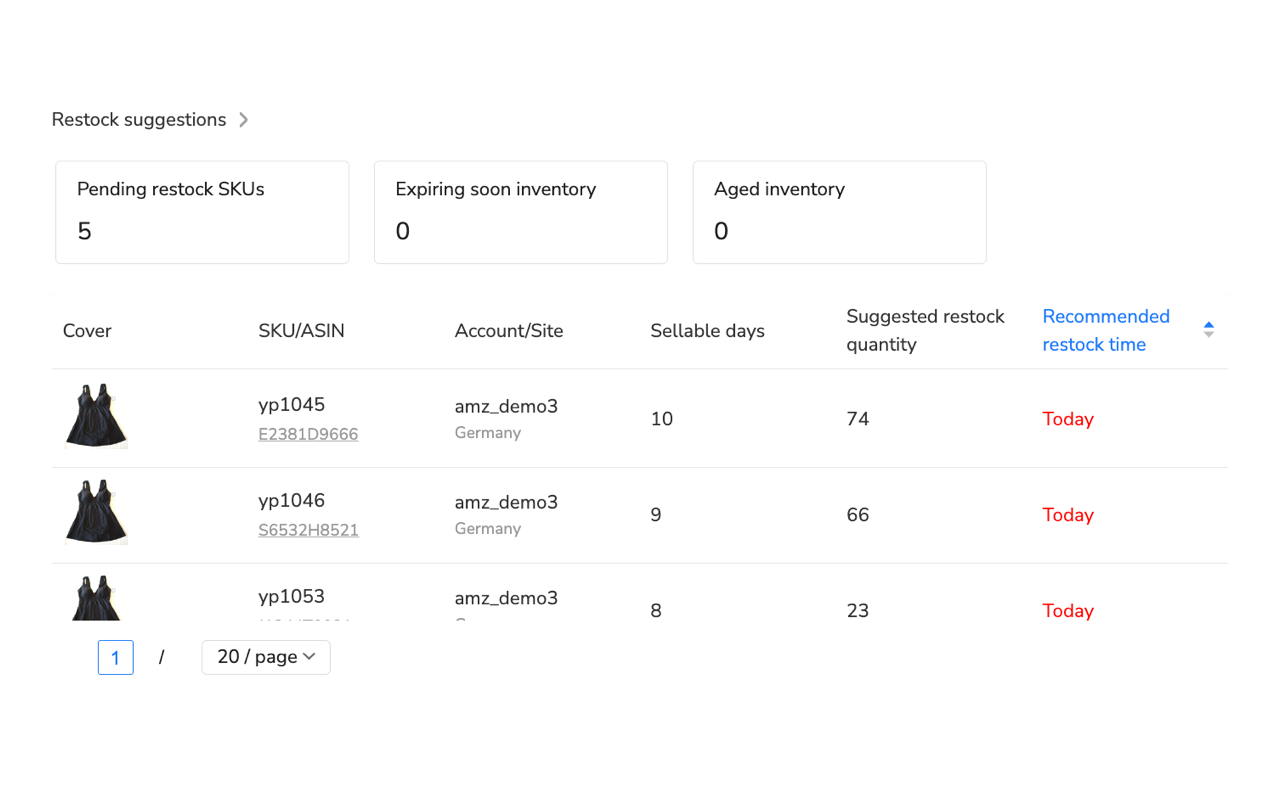
Automated inventory management systems solve this by integrating sales velocity tracking with FBA storage cost calculations. Maxmerce’s FBA Restock Alert feature handles Q4 planning automatically:
- Sales velocity analysis: The system tracks your daily, weekly, and monthly sell-through rates for each SKU, identifying seasonal patterns and trend changes
- Lead time integration: Enter your supplier lead times (e.g., 30 days from order to FBA receipt), and the system factors this into restock timing
- Q4 rate adjustment: Automatically accounts for the October rate increase when calculating optimal inventory levels and storage cost projections
- Safety stock optimization: Balances the cost of stockouts (lost sales + ranking drops) against storage fees to recommend optimal buffer quantities
- Restock recommendations: Generates specific order quantities and timing: “Order 450 units by September 10th to arrive before Q4 without excess storage costs”
- Profit-first calculations: Shows projected storage costs as a percentage of profit margin, flagging SKUs where Q4 storage fees would exceed acceptable thresholds
This automated approach transforms Q4 inventory planning from a stressful guessing game into a data-driven process. Sellers using automated restock alerts typically improve inventory turnover by 30-40% while reducing stockout incidents by 70-80%. One seller with 600 SKUs was manually spending 15-20 hours weekly on restock calculations and still experienced 40+ stockout incidents during Q4 2023. After implementing automated restock alerts, they cut planning time to 2 hours weekly (just reviewing and approving recommendations) and reduced stockouts to 6 incidents in Q4 2024.
The financial impact extends beyond just storage fee savings. Maintaining optimal stock levels during peak season protects your Best Seller Rank, preserves Buy Box win rate, and ensures you capture maximum sales during the highest-revenue period of the year. Missing even three days of stock during Cyber Week can cost thousands in lost revenue and take weeks to recover your rankings.
Identifying High-Risk Inventory Before Fees Spike
Most sellers discover their aged inventory problem after Amazon has already assessed the fees on the 15th of the month. That’s like finding out your house is on fire by reading your insurance claim. You need early warning systems that identify at-risk inventory 30-45 days before surcharges hit, giving you time to implement cost-effective solutions.
The Critical Inventory Metrics to Monitor Daily
Amazon provides inventory age reports in Seller Central, but they’re snapshots in time and require manual analysis to extract actionable insights. Here are the metrics that actually matter for preventing storage fee disasters:
- Days of inventory remaining: Current units divided by average daily sales velocity. If this exceeds 90 days, you’re likely overstocked
- Inventory age by SKU: Exact days each unit has been in FBA, with alerts at 150 days (30 days before first aged fee) and 335 days (30 days before escalated fee)
- Storage cost as percentage of margin: Monthly storage fees divided by per-unit profit margin. If this exceeds 15-20%, take action
- Sell-through rate: Units sold divided by units stored. Rates below 30% monthly indicate serious problems
- Aged inventory approaching thresholds: How many units will cross 181-day or 365-day thresholds in the next 30-45 days, with projected monthly fees
Let’s apply these metrics to a real scenario. You’re selling phone accessories with the following SKU performance:
| SKU | Units in FBA | Inventory Age | Daily Sales | Days Remaining | Monthly Storage | Risk Level |
|---|---|---|---|---|---|---|
| CASE-BLK-01 | 450 | 165 days | 8 | 56 days | $18.50 | High – Aged fees in 16 days |
| CASE-WHT-01 | 280 | 95 days | 12 | 23 days | $11.20 | Low – Selling well |
| CHRG-USB-02 | 820 | 340 days | 2 | 410 days | $67.40 | Critical – 365+ fees in 25 days |
| SCRN-PROT-05 | 190 | 45 days | 15 | 13 days | $5.70 | Medium – Understocked, reorder now |
This table immediately reveals your priorities. CHRG-USB-02 is a disaster waiting to happen—in 25 days, you’ll pay $6.90/cubic foot on 820 units, potentially $200-300 monthly in aged fees alone. You need to make a removal or liquidation decision within the next two weeks.
CASE-BLK-01 is 16 days from aged inventory fees. If you can run a promotion and move 200-300 units in the next two weeks, you’ll reduce your aged fee exposure significantly. The question is whether a 20-25% discount to clear inventory costs less than 4-6 months of aged inventory fees.
SCRN-PROT-05 shows the opposite problem—you’re 13 days from stockout, which will kill your rankings and lose sales during that restock gap. If your supplier needs 30 days, you’re already late on the reorder.
Creating this table manually requires downloading inventory reports, calculating days remaining for each SKU, pulling storage fee data, and updating it daily to catch changes. For a 500-SKU catalog, that’s 45-60 minutes daily—over 5 hours weekly just to know what’s at risk.
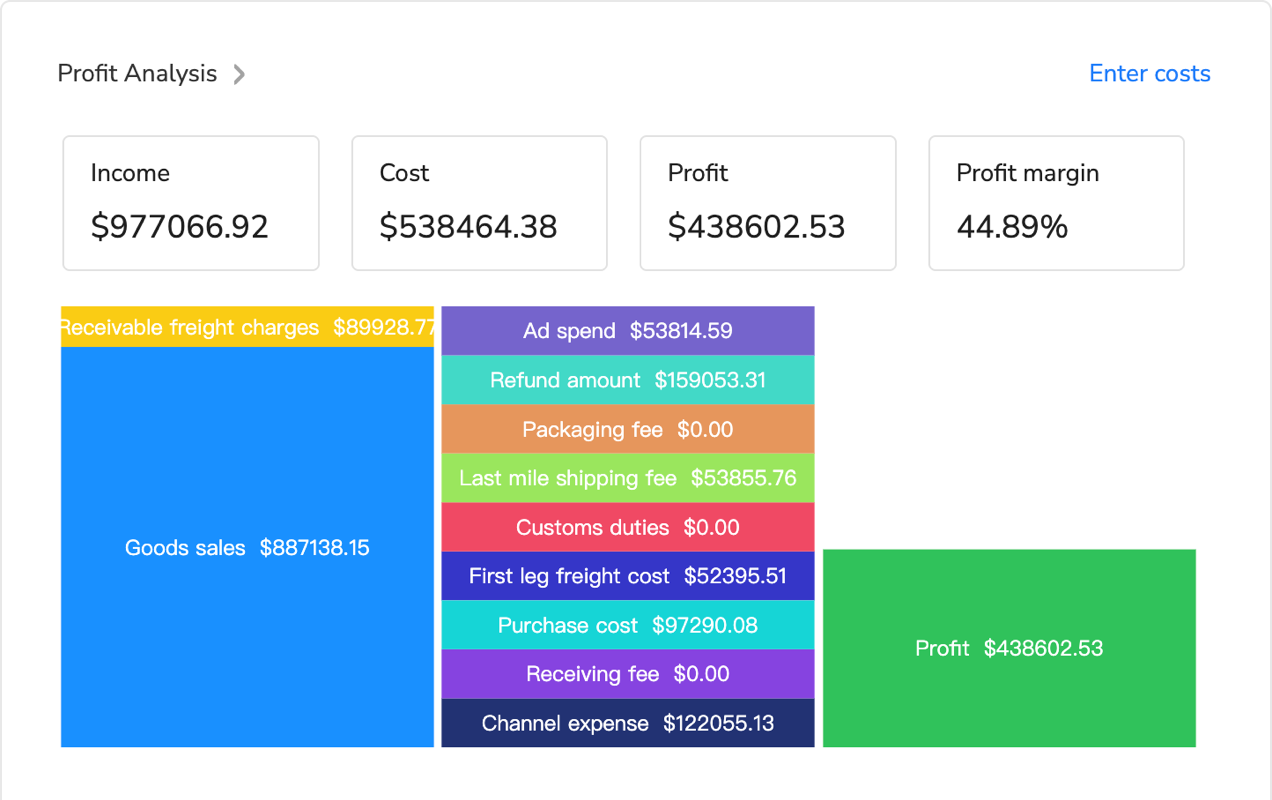
Analytics platforms built for FBA sellers automate this entire process, continuously monitoring every SKU and generating prioritized action lists. When you connect Maxmerce’s Profit Analyzer to your Amazon account, it performs this analysis automatically:
- Daily inventory age monitoring: Every SKU’s age is tracked automatically, with calculations showing exactly when aged fee thresholds will be crossed
- Sales velocity calculation: The system analyzes 7-day, 30-day, and 90-day sales trends to project days of inventory remaining with statistical confidence intervals
- Profit margin integration: Import your product costs and the platform calculates storage fees as a percentage of per-unit profit, flagging SKUs where fees exceed acceptable thresholds
- Prioritized action dashboard: Rather than reviewing 500 SKUs daily, you get a sorted list: “8 SKUs need immediate action, 15 need decisions within 30 days, 42 approaching restock points”
- Cost-benefit recommendations: For each at-risk SKU, the system calculates whether promotion, removal, or liquidation makes the most financial sense based on remaining margin and projected fees
- Multi-scenario projections: See what happens if you run a 20% promotion vs. 30% promotion vs. removal, with projected costs and revenue for each option
This transforms inventory management from reactive firefighting into proactive optimization. You’re not discovering problems after fees have already hit—you’re getting early warnings with specific action plans while you still have cost-effective options.
The impact on profitability is immediate and measurable. Sellers using automated profit analysis with storage cost tracking typically identify $2,000-$8,000 in preventable monthly storage fees within their first week of use. One seller with 1,200 SKUs discovered they had 87 SKUs approaching aged inventory thresholds within 45 days, representing $4,100 in monthly aged fees if no action was taken. By running targeted promotions on 34 SKUs, removing 28 SKUs, and adjusting restock quantities on the rest, they prevented $3,400 of that monthly cost—$40,800 annually.
Storage Cost Reduction Strategies That Protect Rankings
The temptation when facing high storage costs is to slash inventory across the board. That’s how you tank your rankings, lose the Buy Box, and spend six months rebuilding sales momentum. Smart storage cost reduction maintains optimal inventory on your winners while aggressively managing underperformers.
The Profit-First Inventory Segmentation Model
Not all inventory deserves the same management strategy. Segment your catalog into four tiers based on profitability and velocity:
- Tier 1: High profit, high velocity – Your winners. Maintain 30-45 days inventory, never risk stockouts, accept storage costs as part of doing business
- Tier 2: High profit, medium velocity – Solid performers. Keep 30 days inventory, monitor for trend changes, optimize restock timing
- Tier 3: Low profit or low velocity – Problem children. Reduce to 15-20 days inventory, consider price increases or discontinuation
- Tier 4: Aged inventory approaching/past 181 days – Active management required. Promotion, removal, or liquidation decisions within 30 days
Here’s how this looks in practice. You’ve got a 400-SKU catalog with the following distribution:
| Tier | SKU Count | Monthly Revenue | Storage Costs | Strategy |
|---|---|---|---|---|
| Tier 1 | 45 SKUs | $62,000 | $890 | Maintain inventory, accept costs |
| Tier 2 | 120 SKUs | $38,000 | $620 | Optimize restock timing |
| Tier 3 | 180 SKUs | $15,000 | $450 | Reduce inventory levels 40% |
| Tier 4 | 55 SKUs | $3,200 | $1,240 | Aggressive action: remove/liquidate |
The data reveals the problem clearly: 55 SKUs (14% of your catalog) generating only $3,200 in monthly revenue are consuming $1,240 in storage costs—39% of revenue just in storage fees. If you reduce Tier 3 inventory by 40% and aggressively remove Tier 4 inventory, you’d cut storage costs by approximately $1,100 monthly while losing only $3,200 in monthly revenue—which likely wasn’t profitable anyway after all fees.
Promotional Strategies to Clear Aged Inventory Profitably
When you’ve got inventory approaching 181 days, you need to run the math on promotional discounting. The question isn’t “should I discount”—it’s “how much can I discount and still beat the aged inventory fees?”
Let’s say you’ve got a product with the following economics:
- Current price: $29.99
- Cost: $12.00
- FBA fees: $5.50
- Current profit margin: $29.99 – $12.00 – $5.50 = $12.49
- Units in FBA at 165 days: 300 units
- Cubic feet per unit: 0.08 cubic feet
- Total cubic feet: 24 cubic feet
If these 300 units cross 181 days, you’ll pay aged inventory fees of $0.50/cubic foot monthly, or $12/month for this SKU. If they sit for six months with aged fees before you address the problem, that’s $72 in fees. If they cross 365 days and sit another six months, you’re paying $6.90 × 24 = $165.60/month, or nearly $1,000 over that six-month period.
Now let’s calculate your discount threshold. If you run a promotion to clear 200 of the 300 units before aged fees hit:
- 20% discount: New price $23.99, profit margin $6.49/unit, total profit $1,298 on 200 units
- 30% discount: New price $20.99, profit margin $3.49/unit, total profit $698 on 200 units
- 40% discount: New price $17.99, profit margin $0.49/unit, total profit $98 on 200 units
Compare these scenarios to doing nothing and paying aged fees for six months on all 300 units: $72 in fees. A 20% discount generates $1,298 profit while reducing inventory to 100 units, cutting your storage costs by 67% ongoing. That’s clearly the winner.
However, if your inventory is already past 365 days and you’re facing $165.60/month in aged fees, even a 40% discount that generates only $98 profit beats paying $1,000 over six months. You’ve cleared inventory, recovered some capital, and eliminated the monthly fee burden.
The challenge is running these calculations for every at-risk SKU, determining optimal discount levels, and timing promotions for maximum effectiveness. Manually analyzing hundreds of SKUs this way is impractical, so most sellers just guess at discount levels or wait until the problem becomes obvious—by which point they’ve already paid thousands in unnecessary fees.
Automate Aged Inventory Prevention
Get SKU-level recommendations showing exactly when to promote, remove, or liquidate inventory. Calculate optimal discount levels that beat aged inventory fees while preserving profit.
Removal vs. Liquidation: Making the Right Call
When inventory has crossed into aged territory and promotions aren’t moving it fast enough, you’ve got two options: removal orders or Amazon’s liquidation program. The math determines which makes sense.
Removal order costs: Amazon charges $0.50-$0.60 per unit to return inventory to you or dispose of it. For 500 units, that’s $250-$300. You then need to either dispose of it yourself (total loss) or sell through other channels (requires time and effort).
Liquidation recovery: Amazon’s liquidation programs typically recover 5-10% of your product’s value. For a product worth $20, you might recover $1-$2 per unit. On 500 units, that’s $500-$1,000 recovery with no removal fees, but you’re accepting a 90-95% loss.
Here’s the decision framework:
- High-value products with resale potential: Pay removal fees and sell elsewhere (eBay, Walmart, your own website). If the product is worth $50+, recovering 40-60% through other channels beats accepting 5-10% liquidation value
- Low-value commodity products: Liquidate. If removal fees are $0.50/unit on a product worth $8, and you’d need to invest significant time selling elsewhere, just take the liquidation recovery
- Seasonal items past season: Liquidate immediately unless you have storage space to hold for next season. Paying 12 months of aged inventory fees while waiting for next holiday season rarely makes financial sense
- Products approaching 365 days: Make this decision 30 days before that threshold. Don’t wait until you’re paying $6.90/cubic foot monthly
One seller with 1,200 units of seasonal Halloween costumes analyzed their options in November:
- Option A: Hold until next October (11 months). Pay aged fees $180/month × 11 months = $1,980. Hope to sell at full margin next season
- Option B: Remove at $600 cost, store in personal warehouse, relist next September. Storage + time investment ~$400, total cost $1,000
- Option C: Liquidate now, recover $800 (10% of $8,000 inventory value), move on
They chose Option B because the products had proven demand and 60% profit margins when sold at full price. However, if margins were lower or demand uncertain, Option C’s immediate cost containment would have been smarter.
Automating Storage Cost Management at Scale
Everything we’ve covered so far—calculating storage costs by SKU, projecting aged inventory fees, timing promotions, making removal decisions—works fine if you’ve got 20-30 SKUs and can dedicate hours weekly to inventory analysis. But most successful FBA sellers have 200-2,000 SKUs, often across multiple marketplaces. Manual tracking becomes impossible at that scale.
The ROI of Automated FBA Inventory Management
Let’s quantify the time and money equation for manual versus automated inventory management. You’re running 600 SKUs across Amazon, with some inventory also fulfilling orders from eBay and Walmart via Multi-Channel Fulfillment:
Manual approach time investment:
- Download and analyze inventory age reports: 45 minutes daily = 5.25 hours weekly
- Calculate storage costs per SKU: 2 hours weekly
- Project aged inventory thresholds: 1.5 hours weekly
- Create restock recommendations: 3 hours weekly
- Analyze profitability by SKU: 2 hours weekly
- Generate reports for decision-making: 1.5 hours weekly
- Total weekly time: 15.25 hours
If your time is worth $50/hour (conservative for a business owner), that’s $763/week or $3,052/month in opportunity cost. Additionally, manual tracking is reactive—you discover problems after they’ve already cost money rather than preventing them proactively.
Automated approach with analytics platform:
- One-time setup: 2-3 hours connecting accounts and configuring settings
- Daily dashboard review: 15-20 minutes checking prioritized alerts and recommendations
- Weekly strategic review: 1 hour analyzing trends and approving major decisions
- Total weekly time: 2.75 hours (82% reduction)
- Opportunity cost at $50/hour: $138/week or $552/month
Time savings alone justify automation, but the financial impact extends far beyond time. Automated systems prevent aged inventory fees proactively, optimize restock timing to reduce storage costs, identify unprofitable SKUs eating margin, and maintain optimal inventory on winners to protect rankings and sales. Sellers using automated FBA inventory management typically see:
- 40-60% reduction in storage fees: Early intervention on aged inventory + optimized restock timing
- 70-80% fewer stockout incidents: Automated restock alerts prevent inventory gaps
- 15-25% improvement in inventory turnover: Maintaining 30-45 day inventory levels instead of 60-90 days
- $2,000-$8,000 monthly in prevented fees: For mid-size sellers ($50K-$150K monthly revenue)
One Maxmerce customer running 800 SKUs with $120,000 monthly revenue was paying $4,800 monthly in storage fees before automation, including $2,100 in aged inventory fees they weren’t aware of until quarterly reviews. Within 90 days of implementing automated tracking:
- Storage fees dropped to $1,900/month: 60% reduction through proactive aged inventory removal and optimized restock timing
- Stockouts decreased from 35-40 monthly to 6-8 monthly: Protecting rankings and sales velocity
- Inventory turnover improved from 4.2× annually to 6.8× annually: Freeing up $18,000 in working capital for new product sourcing
- Time spent on inventory management dropped from 18 hours weekly to 3 hours weekly: Allowing focus on growth activities
The ROI calculation is straightforward: $2,900/month in storage fee savings + $900/month in time savings = $3,800/month value, or $45,600 annually. The investment in an analytics platform typically runs $100-$300/month depending on scale, delivering 12-38× ROI.
What to Look for in FBA Inventory Management Tools
Not all inventory management platforms are created equal. Many focus on basic stock tracking without the profitability analytics and storage fee optimization that actually move the needle. Here’s what separates useful tools from game-changers:
- Real-time inventory age tracking: Daily monitoring of every SKU’s age with automated calculations of days until aged fee thresholds
- Profit margin integration: Calculate storage fees as a percentage of per-unit profit, not just absolute dollar amounts
- Multi-channel visibility: If you’re using FBA inventory for Amazon, eBay (via MCF), and Walmart, see total storage costs across all sales channels
- Seasonal rate adjustment: Automatically factor in October rate increases when projecting Q4 storage costs and restock recommendations
- Actionable alerts with specific recommendations: Not just “this SKU is aged” but “run 25% promotion to clear 200 units by Nov 1st, or pay $87/month in aged fees”
- Scenario planning: Model the financial impact of different strategies (promote vs. remove vs. liquidate) before committing
- Integration with advertising and profitability data: Understand true profit after all costs including PPC, storage, and returns
When evaluating platforms like Maxmerce’s Analytics module, look for this complete feature set working together, not just point solutions for individual problems. The power comes from integrated visibility—seeing how storage costs impact profitability, how restock timing affects both storage fees and sales momentum, and how promotional strategies preserve margin while clearing aged inventory.
The best platforms also integrate with your broader operations. If you’re running PPC campaigns, you need to see how ad spend + storage costs affect true profitability. If you’re managing customer service, you need to understand how return rates impact storage costs and aged inventory risk. Siloed tools create more work, not less.
Advanced Storage Cost Optimization Strategies
Once you’ve got the basics mastered—tracking inventory age, preventing aged fees, optimizing restock timing—you can implement advanced strategies that compound savings and improve overall business profitability.
Strategic Use of Multi-Channel Fulfillment to Reduce Storage Burden
Amazon’s Multi-Channel Fulfillment (MCF) lets you use FBA inventory to fulfill orders from other channels like eBay, Walmart, and your own website. This creates opportunities to monetize slow-moving FBA inventory through additional channels, reducing storage burden while generating revenue.
Here’s the strategy: You’ve got a product that sells 5 units/day on Amazon but you’ve got 450 units in stock (90 days inventory). List it on eBay and Walmart. If you sell an additional 3 units/day through these channels, you’ve increased velocity by 60%, reducing your days of inventory from 90 to 56 days—cutting storage duration and costs by 38%.
The MCF fee structure makes this work: You pay FBA fulfillment fees plus a small MCF surcharge, but you’re generating revenue that would otherwise sit in inventory. For a standard-size item, MCF fees run $3.50-$5.50 depending on shipping speed. If your profit margin on eBay or Walmart is $8-12 after all fees, you’re still making money while reducing storage burden.
However, the complexity scales with catalog size. Managing inventory sync across Amazon, eBay, and Walmart for 600 SKUs manually is a recipe for overselling disasters and hours of daily administrative work. Multi-channel inventory management platforms automate this, ensuring your 450 units in FBA accurately represent available inventory across all channels in real-time.
Profit-First Product Lifecycle Management
Many sellers treat every product equally, maintaining the same inventory levels and accepting the same storage costs regardless of profitability or lifecycle stage. Smart operators segment inventory management by product lifecycle:
- Launch phase (months 1-3): Maintain higher inventory (45-60 days) to prevent stockouts while building ranking and reviews. Accept higher storage costs as investment in momentum
- Growth phase (months 4-12): Optimize to 30-45 days inventory. This is peak profitability—maximize sales while controlling costs
- Maturity phase (year 2+): Reduce to 20-30 days inventory. Competition has likely increased, margins compressed—minimize storage costs
- Decline phase: Aggressive inventory reduction to 15-20 days or discontinuation. Don’t let declining products consume storage space that could hold winners
This lifecycle-based approach requires tracking product age, sales trends, and profitability over time—something that’s nearly impossible manually but straightforward with analytics platforms that maintain historical data and trend analysis.
Inventory Segmentation by Storage Cost Efficiency
Not all products bear storage costs equally. A small, high-value item might pay $2/month in storage fees on a $50 profit margin (4% of margin). A large, low-value item might pay $15/month on a $20 profit margin (75% of margin). The second product needs far more aggressive inventory management than the first.
Calculate storage cost efficiency for each SKU: (Monthly profit margin – Monthly storage cost) / Cubic feet. This reveals your most and least storage-efficient products. Focus inventory investment on high-efficiency SKUs; aggressively manage or discontinue low-efficiency SKUs.
One seller running this analysis across 600 SKUs discovered that 80 SKUs (13% of catalog) had storage costs exceeding 40% of profit margins. These products were generating $8,200/month in revenue but only $1,400/month in profit after storage costs—effectively a 17% profit margin. By discontinuing 35 SKUs and reducing inventory 60% on the remaining 45 SKUs, they freed up $12,000 in working capital, cut storage costs by $780/month, and only gave up $2,800 in monthly revenue that wasn’t profitable anyway.
Common FBA Storage Fee Mistakes and How to Avoid Them
Even experienced sellers fall into predictable traps when managing FBA storage costs. Here are the most expensive mistakes and how to prevent them.
Mistake 1: Sending Inventory Without Storage Cost Analysis
Many sellers calculate FBA profitability at the per-sale level (revenue – COGS – FBA fees – advertising) but ignore storage costs in the equation. A product might look profitable at $8 margin per sale, but if it sits 180 days in FBA paying $0.40/month in storage, you’ve cut that margin to $5.60 before the sale even happens.
Prevention: Before sending any new product to FBA, calculate projected monthly storage costs based on expected velocity. If your average days of inventory (DOI) runs 60 days and monthly storage for this SKU is $0.60/unit, factor in $1.20 in storage costs to your profitability calculation. If that cuts your margin below your threshold (typically 20-30% net), reconsider the product or adjust restock quantities.
Mistake 2: Ignoring Inventory Age Until Amazon Sends Alerts
Amazon sends inventory age alerts when you’re approaching or have crossed aged inventory thresholds. By that point, you’ve got 15-30 days to make removal decisions before fees hit. Most sellers don’t see these alerts in time or can’t execute fast enough, resulting in unnecessary fee assessments.
Prevention: Monitor inventory age starting at 120 days, not 181 days. When a SKU crosses 120 days with slow velocity, you have 60 days to implement promotions, adjust pricing, or make removal decisions—enough time to clear inventory profitably rather than panic-removing at the last minute.
Mistake 3: Over-Ordering to Hit MOQ Without Storage Cost Consideration
Suppliers often offer better pricing at higher minimum order quantities (MOQs). Sellers do the unit economics—”$8 cost at 500 units vs $10 cost at 200 units, so I’ll order 500″—without factoring in storage costs for the extra 300 units that might sit 6-12 months.
Prevention: Calculate the true break-even including storage costs. If those 300 extra units save $2/unit ($600 total) but pay $40/month in storage fees for 8 months while selling through ($320 in fees), your actual savings dropped to $280. If they cross into aged inventory territory, you’re losing money on the “discount.”
Mistake 4: Treating All Inventory Equally During Q4 Planning
Sellers often send their entire catalog to FBA in September/October to prepare for Q4, treating all products as equal holiday opportunities. However, not all products see Q4 lift, and you’re paying premium storage rates on inventory that could wait until January to restock.
Prevention: Segment products by historical Q4 performance. If a product sees 200%+ lift October-December, stock up in September. If it sees only 20-30% lift, delay restocking until mid-November when some Q4 inventory has sold down, reducing your exposure to premium storage rates.
Mistake 5: Ignoring Stranded and Unfulfillable Inventory
Stranded inventory (listings suppressed for various reasons) and unfulfillable inventory (damaged or customer returns) still accumulate storage fees, including aged inventory fees. Many sellers don’t notice these categories until thousands of dollars in fees have accumulated.
Prevention: Weekly review of stranded and unfulfillable inventory categories in Seller Central. Stranded inventory often just needs listing fixes to become sellable again. Unfulfillable inventory should be removed or disposed of immediately—you’re paying storage costs for products you can’t sell.
Transform FBA Storage Costs from Profit Drain to Strategic Advantage
Get complete visibility into storage costs by SKU, automated aged inventory alerts, profit-first restock recommendations, and multi-channel inventory optimization—all in one platform.
Frequently Asked Questions
How much do Amazon FBA storage fees cost per month?
Standard-size items cost $0.87 per cubic foot January-September and $2.40 October-December. Oversized items run $0.56 per cubic foot January-September and $1.40 October-December. Aged inventory incurs additional long-term storage fees: $0.50/cubic foot after 181-365 days and $6.90/cubic foot after 365+ days. These fees are assessed monthly based on daily average inventory volume.
When do aged inventory surcharges apply?
Amazon assesses aged inventory surcharges on the 15th of each month. Inventory aged 181-365 days incurs $0.50 per cubic foot monthly. Inventory aged 365+ days gets hit with $6.90 per cubic foot monthly—potentially exceeding your product’s entire profit margin. The inventory age clock starts when Amazon receives your shipment at the fulfillment center, not when you ship it.
What’s the best way to calculate true FBA storage costs?
Calculate monthly storage fees (cubic feet × rate), add aged inventory surcharges for slow movers, factor in Q4 rate increases (175% higher), and account for removal fees if liquidation becomes necessary. The most important metric is storage cost as a percentage of profit margin—if this exceeds 15-20%, take action. Real-time inventory tracking tools can automate this calculation across your entire catalog, flagging at-risk SKUs before fees spike.
How can I reduce FBA storage fees without killing my rankings?
Run targeted promotions on slow-moving inventory 30-45 days before aged inventory thresholds. Remove aged inventory before surcharge dates and liquidate through Amazon Outlet or removal orders. Optimize restock timing using 30-45 day supply targets instead of 90-day buffers. Monitor daily sales velocity to adjust inventory levels proactively. The key is maintaining optimal inventory on your winners (protecting rankings) while aggressively managing underperformers (controlling costs).
What inventory metrics should I track to avoid storage fee disasters?
Track days of inventory remaining (units ÷ daily velocity), inventory age by SKU, storage cost per unit as percentage of profit margin, sell-through rate (units sold / units stored), and aged inventory approaching 181 and 365-day thresholds. Analytics platforms with FBA inventory tracking provide automated alerts when these metrics enter danger zones, giving you 30-45 days to implement cost-effective solutions.
Should I use Amazon’s inventory removal or liquidation programs?
Compare removal fees ($0.50-$0.60 per unit) versus liquidation recovery rates (5-10% of value typically). If product value is low and aged inventory fees would exceed liquidation recovery, liquidate. If product has resale value elsewhere (eBay, Walmart, other channels), pay removal fees and sell through those channels. Make this decision 30 days before aged inventory surcharges hit—waiting costs hundreds to thousands in unnecessary fees.
How do I calculate the break-even point for keeping inventory in FBA?
Calculate monthly profit per unit, subtract monthly storage fees per unit, subtract projected aged inventory surcharges if applicable, and factor in opportunity cost of capital tied up. If monthly storage + aged fees exceed 30% of per-unit profit, it’s eating too much margin. If fees exceed profit entirely, remove immediately. Don’t forget to account for Q4 rate increases when projecting future storage costs.
What’s the difference between storage fees and storage-type fees?
Monthly storage fees apply to all inventory based on cubic feet and season (standard vs Q4 rates). Aged inventory surcharges apply only to units stored 181+ days at escalating rates ($0.50 after 181 days, $6.90 after 365 days). Storage-type fees refer to special handling categories like dangerous goods, apparel, or oversize items. The combination can devastate margins—one seller paid $2,400 in aged fees on inventory worth only $1,800, discovering too late that storage costs exceeded product value.
Conclusion: From Reactive Storage Fee Management to Proactive Profit Optimization
Amazon FBA storage fees don’t have to be a mysterious line item eating 15-30% of your profits. The sellers who master storage cost management share one trait: they’ve stopped reacting to fees after they’ve hit and started preventing them through systematic monitoring and early intervention.
The path forward is straightforward. Calculate your true storage costs including seasonal rate changes and aged inventory risks. Implement daily monitoring of inventory age and velocity metrics. Segment your catalog by profitability and manage accordingly—protect your winners, aggressively manage underperformers. Make removal or liquidation decisions 30-45 days before aged fees hit, not after. Most importantly, automate these processes at scale rather than drowning in manual spreadsheet management.
Sellers who implement automated FBA inventory tracking typically see 40-60% storage cost reductions within 90 days, preventing $2,000-$8,000 monthly in unnecessary fees. That’s $24,000-$96,000 annually that flows directly to your bottom line—or gets reinvested in inventory for your best-performing products.
The question isn’t whether you can afford analytics and automation tools for storage cost management. It’s whether you can afford to keep bleeding thousands of dollars monthly in preventable aged inventory fees while spending 15+ hours weekly on manual inventory analysis. The math isn’t close.
Start by auditing your current storage costs. Download your inventory age report, identify everything over 150 days, calculate your exposure to aged fees in the next 30-60 days, and take immediate action on your highest-risk SKUs. Then implement systematic tracking to prevent the next generation of aged inventory before it costs you another penny.