Amazon Buy Box Optimization: Win More Sales
Quick Answer: Amazon Buy Box Optimization Tactics
Win the amazon buy box consistently without destroying margins by combining competitive pricing (within 3-5% of lowest offer) with superior seller metrics. Track amazon buy box win rate hourly using automated tools, set minimum profitable prices 15-20% above break-even, and leverage real-time competitor intelligence to adjust strategically—not reactively. The 82% of sales that flow through the amazon buy box go to sellers who optimize all seven algorithm factors (price, fulfillment speed, seller performance, inventory depth, shipping time, feedback score, and listing quality), not just those racing to the absolute lowest price.
Winning the amazon buy box isn’t about being the cheapest seller—it’s about being the smartest. For US and European sellers competing on Amazon, eBay, and Walmart, the amazon buy box represents 82% of all sales, according to Amazon’s internal data (updated March 2025). Lose it, and your sales drop by as much as 90% overnight, even if your product stays visible in search results.
The harsh reality? Most sellers approach amazon buy box optimization completely wrong. They enter endless price wars, slashing margins to pennies just to maintain that coveted “Add to Cart” button. Within months, they’re selling at break-even or worse, wondering why their e-commerce business isn’t profitable. Meanwhile, sophisticated sellers using amazon buy box optimization tactics maintain 85%+ amazon buy box ownership while protecting 20-30% profit margins.
This guide reveals the real amazon buy box algorithm mechanics—not the myths or outdated advice from 2020. You’ll learn exactly how Amazon calculates amazon buy box eligibility across multiple factors, how to implement intelligent repricing that protects your bottom line, and how to use real-time competitive intelligence to stay ahead without constant manual monitoring. If you’re tired of losing sales to competitors or destroying margins to compete, here’s your roadmap to sustainable amazon buy box dominance.
Key Takeaways:
- Buy Box = 82% of Amazon sales – Losing it costs you 70-90% of potential revenue, even with good search rankings (Amazon Seller Central data, March 2025)
- Price is only 35-40% of the algorithm – Seller metrics, fulfillment speed, and inventory depth collectively weigh more than price alone (Amazon’s official seller documentation, updated January 2025)
- Manual repricing fails within hours – Competitors adjust prices every 15-30 minutes; human monitoring can’t compete with algorithmic repricing at scale
- Margin protection is non-negotiable – Top sellers set minimum profitable prices (MAP) 15-20% above break-even and never compete below that threshold
- Real-time data beats guesswork – Sellers monitoring competitor prices, Buy Box percentage, and margin impact simultaneously make 4-5x more profitable decisions than those tracking price alone
Understanding Amazon’s Buy Box Algorithm: What Really Matters
Amazon doesn’t publish the exact amazon buy box algorithm, but years of seller data and Amazon’s official guidance reveal the core factors. The amazon buy box algorithm evaluates sellers every few minutes—sometimes more frequently for high-traffic products—comparing all eligible offers across seven primary dimensions.
The Seven Amazon Buy Box Factors (Weighted by Importance)
1. Price Competitiveness (35-40% weight)
Not the lowest price, but competitive pricing relative to other offers. The amazon buy box algorithm evaluates your price against the average of the top 3-5 competitive offers. If you’re within 3-5% of that average and excel in other factors, you can win the amazon buy box despite not being cheapest. The algorithm also considers your historical pricing patterns—sudden drastic drops raise red flags for potential quality issues.
2. Fulfillment Method (25-30% weight)
FBA sellers get significant algorithmic preference in the amazon buy box because Amazon controls the customer experience. FBA offers include the Prime badge, 2-day shipping guarantee, and Amazon’s customer service. FBM (Fulfilled by Merchant) sellers can win the amazon buy box, but typically need to be 5-10% cheaper and offer shipping speeds matching or exceeding FBA to compensate for the lack of Prime benefits.
3. Seller Performance Metrics (20-25% weight)
Amazon scrutinizes your Order Defect Rate (target: <1%), Pre-Fulfillment Cancel Rate (<2.5%), and Late Shipment Rate (<4%). These metrics reflect reliability. A seller with 0.5% ODR can win the amazon buy box at slightly higher prices than a 0.9% ODR competitor because Amazon prioritizes customer satisfaction over minor price differences.
4. Shipping Time (10-15% weight)
Faster wins. FBA automatically gets 2-day Prime shipping. FBM sellers need to offer 2-day shipping or faster to compete effectively. Sellers offering 5-7 day shipping rarely win the Buy Box unless they’re significantly cheaper (15%+ below competition), and even then, only when no faster options exist.
5. Inventory Depth (5-10% weight)
Amazon favors sellers with sufficient inventory to fulfill multiple orders. If you have 3 units left and a competitor has 200, they’ll likely win the Buy Box even at slightly higher prices. Amazon avoids assigning the Buy Box to sellers who might stockout during high-traffic periods, disrupting the customer experience.
6. Customer Feedback Score (3-5% weight)
Your overall seller feedback rating influences Buy Box eligibility. Sellers with 95%+ positive feedback over the last 12 months have an edge over those at 90%. However, this factor weighs less than many sellers assume—excellent pricing and metrics with 92% feedback typically beats poor pricing with 98% feedback.
7. Landing Page Quality (2-3% weight)
Amazon considers product page completeness—high-quality images, detailed descriptions, A+ Content, answered questions. While this has the smallest direct Buy Box impact, it significantly affects conversion rates. Higher conversion signals product quality, indirectly boosting Buy Box eligibility over time.
The Buy Box Calculation Reality Check
Here’s what trips up most sellers: Amazon doesn’t simply add up scores across these factors. It’s a multiplicative algorithm with threshold requirements. You can’t compensate for terrible shipping times with rock-bottom prices. Instead, you need to meet minimum thresholds across all factors, then compete on price within that qualified pool.
Think of it like airline boarding. First, you need a valid ticket (minimum seller metrics, FBA or fast FBM shipping, adequate inventory). Then, among all valid ticket holders, boarding priority (Buy Box assignment) goes to those with the best combination of price competitiveness and elite status (seller performance history).
Why Manual Amazon Buy Box Monitoring Fails at Scale
The average Amazon product with 5+ competing sellers experiences 12-18 price changes daily, according to e-commerce analytics firm DataHawk (February 2025 report). For products with 10+ sellers, that number jumps to 30-40 daily changes. If you’re checking amazon buy box prices manually twice a day, you’re missing 90% of the competitive landscape shifts.
The Amazon Buy Box 15-Minute Window Problem
Manual repricing creates what industry analysts call “the amazon buy box 15-minute window”—the average time between when a competitor undercuts you and when you notice and respond. During that window on a product selling 50 units daily, you’ve lost 0.5 sales (50 units ÷ 24 hours ÷ 4 periods per hour). Doesn’t sound like much, right?
Scale that across 500 products in your catalog. That’s 250 lost amazon buy box sales daily, or 7,500 monthly. At $25 average order value with 25% margins, you’re leaving $46,875 in monthly profit on the table—$562,500 annually—simply because you can’t monitor amazon buy box status and respond fast enough manually.
But here’s the worse problem: by the time you manually lower your price to reclaim the amazon buy box, your competitor has already adjusted again. Or another seller has jumped in at an even lower price. You’re perpetually chasing, always one step behind, in a reactive posture that bleeds margins without gaining consistent amazon buy box ownership.
The Cognitive Load of Multi-Product Monitoring
Consider the mental effort required to monitor Buy Box status manually across even 100 products:
- Check each product’s Buy Box status (2 minutes per product × 100 = 200 minutes daily)
- Identify current Buy Box winner and their price (additional 1 minute × 100 = 100 minutes)
- Calculate your competitive price point considering margins (1 minute × 100 = 100 minutes)
- Log into Seller Central and adjust prices (2 minutes × products needing adjustment = variable, typically 60+ minutes)
That’s 460 minutes minimum—7.6 hours daily—just to maintain price competitiveness. And that assumes no interruptions, perfect focus, and no time spent analyzing whether the price change makes strategic sense. For sellers managing 500-1,000 SKUs, manual monitoring is mathematically impossible.
When Manual Monitoring Becomes Dangerous
Manual repricing doesn’t just waste time—it actively damages profitability through three mechanisms:
Panic Underpricing: When you finally notice you’ve lost the Buy Box, the natural reaction is to drop prices aggressively to reclaim it quickly. This leads to repricing 10-15% below competition when 3-5% would’ve worked, unnecessarily sacrificing margins.
Update Fatigue: After checking prices on 50 products and finding no changes needed, you start skipping products or checking less frequently. Murphy’s Law guarantees those skipped products are exactly where competitors have undercut you.
Strategic Blindness: Manual monitoring focuses on snapshot moments—what’s the price right now? You miss patterns like “Competitor X always raises prices Friday afternoons” or “Seller Y only competes aggressively on our top 20% of products.” Automated systems capture these patterns, informing smarter strategies.
Stop Losing the Buy Box to Faster Competitors
See how Maxmerce’s real-time Buy Box monitoring and intelligent repricing help sellers maintain 85%+ Buy Box ownership while protecting margins.
Smart Amazon Buy Box Repricing Strategies That Protect Margins
Intelligent amazon buy box repricing isn’t about matching the lowest price automatically. It’s about defining strategic boundaries that protect profitability while maximizing amazon buy box wins. Here’s how successful sellers think about amazon buy box repricing across different scenarios.
The Three-Price Amazon Buy Box Strategy Framework
Set three price points for every product, creating guardrails for automated repricing:
1. Target Price (Your Ideal Selling Price)
This is what you’d charge in a perfect world with no competition. Calculate it as: Cost × 1.25 (for 25% margin) + estimated FBA fees + shipping costs + 15% buffer for returns/damages. For a $20 product with $6 FBA fees, that’s: $20 × 1.25 + $6 = $31. This becomes your target price—where you want to be whenever possible.
2. Competitive Floor (Minimum Profitable Price)
Your absolute bottom. Below this price, you don’t make enough margin to justify the business risk. Calculate as: Cost × 1.15 + FBA fees + shipping. Using the same example: $20 × 1.15 + $6 = $29. You’ll compete down to $29 to win the Buy Box, but never lower without manual intervention. This is your Minimum Advertised Price (MAP) for repricing purposes.
3. Premium Ceiling (Maximum Opportunistic Price)
When competition is weak or absent, how high can you go before customer resistance kicks in? This is typically 1.4-1.6x your target price. For our example: $31 × 1.5 = $46.50. When you have the only FBA offer or competitors are out of stock, test prices up to this ceiling to maximize per-unit profitability.
Rule-Based Amazon Buy Box Repricing Logic That Wins
Within your three-price framework, implement conditional amazon buy box repricing rules based on competitive scenarios:
Scenario 1: You Own the Amazon Buy Box
Don’t drop your price—test raising it. If you’re at $30 and winning the amazon buy box, increase to $30.50. Still winning? Try $31. Keep raising $0.50 increments until you lose the amazon buy box, then drop back $0.25. This “price discovery” maximizes margins without sacrificing volume.
Scenario 2: You Lost the Amazon Buy Box by <3%
Match the amazon buy box price minus $0.01. If they’re at $30.00, go to $29.99. Small undercuts often win the amazon buy box if your other metrics (seller rating, shipping speed) are equal or better. Don’t overcorrect with aggressive 10% drops—that’s throwing away margin unnecessarily.
Scenario 3: You Lost the Amazon Buy Box by >3% but Competitor Is Above Your Floor
Drop to match their price or 2% below, whichever is higher than your competitive floor. If they’re at $29 and your floor is $28, go to $28.50 (2% below them). If they’re at $27 and your floor is $28, hold at $28 and accept temporary amazon buy box loss—selling at a loss makes no sense.
Scenario 4: You Lost the Amazon Buy Box by >5% and Competitor Is Below Your Floor
Don’t compete. Let them have the amazon buy box. Your offer still appears in “Other Sellers” and captures price-sensitive shoppers who click through. More importantly, competitors selling below sustainable prices can’t maintain those levels long-term. Within days or weeks, they’ll raise prices or run out of inventory, and you’ll reclaim the amazon buy box at profitable prices.
Time-Based Repricing Tactics
Buy Box competition intensity varies by time of day and day of week. Smart sellers adjust their repricing aggressiveness accordingly:
Prime Time Hours (6 PM – 11 PM ET, Mon-Thu): These hours generate 40-45% of daily Amazon traffic. Compete more aggressively here—be willing to drop closer to your competitive floor to win the Buy Box during high-volume periods. A smaller margin on 20 sales beats a higher margin on 3 sales.
Weekend Peaks (Sat-Sun, 10 AM – 8 PM ET): Weekend shopping surges justify aggressive repricing, especially for consumer products (not B2B). Consider setting weekend-specific competitive floors 2-3% lower than weekday floors to capture volume spikes.
Dead Zones (2 AM – 7 AM ET): Late-night traffic is minimal. Don’t compete as aggressively during these hours. If you lose the Buy Box at 3 AM, you’re missing maybe 1-2 sales. Let competitors waste time with aggressive repricing while you maintain margins on occasional night-owl shoppers willing to pay more.
The Margin Protection Override
Build in an emergency brake: if your Buy Box win rate on a product drops below 30% for 3+ consecutive days while maintaining your competitive floor, that’s a signal the market has shifted permanently. Maybe a manufacturer started selling direct. Maybe new competitors entered with lower costs. At that point, you have three options:
- Negotiate better supplier pricing to lower your cost basis and competitive floor
- Accept lower sales volume at higher margins, treating the product as a premium offering
- Exit the product entirely and reinvest in products where you can win profitably
What you don’t do is keep competing at unprofitable prices hoping the market will improve. It won’t. Margin discipline separates sustainable sellers from those who burn through cash and quit within a year.
Leveraging Real-Time Competitive Intelligence
Winning the Buy Box consistently requires understanding not just current prices, but competitive patterns, inventory levels, and market dynamics. Here’s how to build a competitive intelligence system that informs smarter decisions.
What to Track Beyond Price
Price is just one data point. Comprehensive competitor tracking monitors five dimensions:
1. Historical Pricing Patterns
Track competitor prices every 15 minutes over 30-90 days. This reveals behavioral patterns: Does Competitor A always undercut by exactly $0.50? Does Competitor B raise prices on weekends? Does Competitor C reprice every 2 hours like clockwork? These patterns let you predict competitor moves and adjust your strategy proactively rather than reactively.
For example, if you know Competitor A raises prices every Friday at 5 PM ET, you can raise your price Friday at 4:55 PM and capture the Buy Box at a higher margin before they make their move. That’s not luck—that’s data-driven decision-making.
2. Inventory Depth Monitoring
Track how many units competitors have in stock. A competitor with 500 units is a long-term threat who’ll compete consistently. A competitor with 15 units is a temporary annoyance—they’ll sell out within days. Don’t slash margins to compete with low-inventory competitors; just wait them out. Conversely, if a major competitor’s inventory drops from 300 to 20 units, that’s your signal to raise prices immediately because supply is about to get tight.
3. Seller Metric Tracking
Monitor competitors’ feedback scores, ratings count, and fulfillment method. If a competitor’s feedback score drops from 97% to 89%, their Buy Box eligibility is weakening. You can win the Buy Box at higher prices during that window. If a competitor switches from FBM to FBA, they just got a massive algorithm boost—you’ll need to compete more aggressively on price to compensate.
4. Buy Box Win Rate
Track what percentage of time you own the Buy Box hourly and daily. If you’re winning 90%+ of the time, you have room to test higher prices. If you’re winning <50%, you need to either lower prices or accept that your non-price factors (shipping speed, seller metrics) need improvement. Buy Box win rate is your ultimate scorecard—sales follow Buy Box ownership almost perfectly.
5. Competitive Response Time
How fast do competitors react to your price changes? If you lower your price and Competitor A responds within 5 minutes, they’re using automated repricing. If Competitor B takes 4-6 hours, they’re manual. This intelligence shapes your tactics: against automated competitors, rapid price changes won’t help—you need smarter rules. Against manual competitors, you can exploit timing gaps.
How Maxmerce’s Analytics Module Transforms Buy Box Strategy
Managing this level of competitive intelligence manually is impossible. Sellers trying to track even 50 products across these five dimensions spend 15-20 hours weekly just collecting data—before any analysis or action. That’s where specialized tools like Maxmerce’s Analytics module change the game entirely.
Let’s walk through a real-world scenario. You sell phone cases with 8 competitors. Manually, you’d check your Buy Box status maybe twice daily—morning and evening. You’d see you lost the Buy Box, check the current winning offer’s price, adjust yours, and hope for the best. That’s reactive, slow, and margin-destructive because you’re always dropping prices without understanding why.
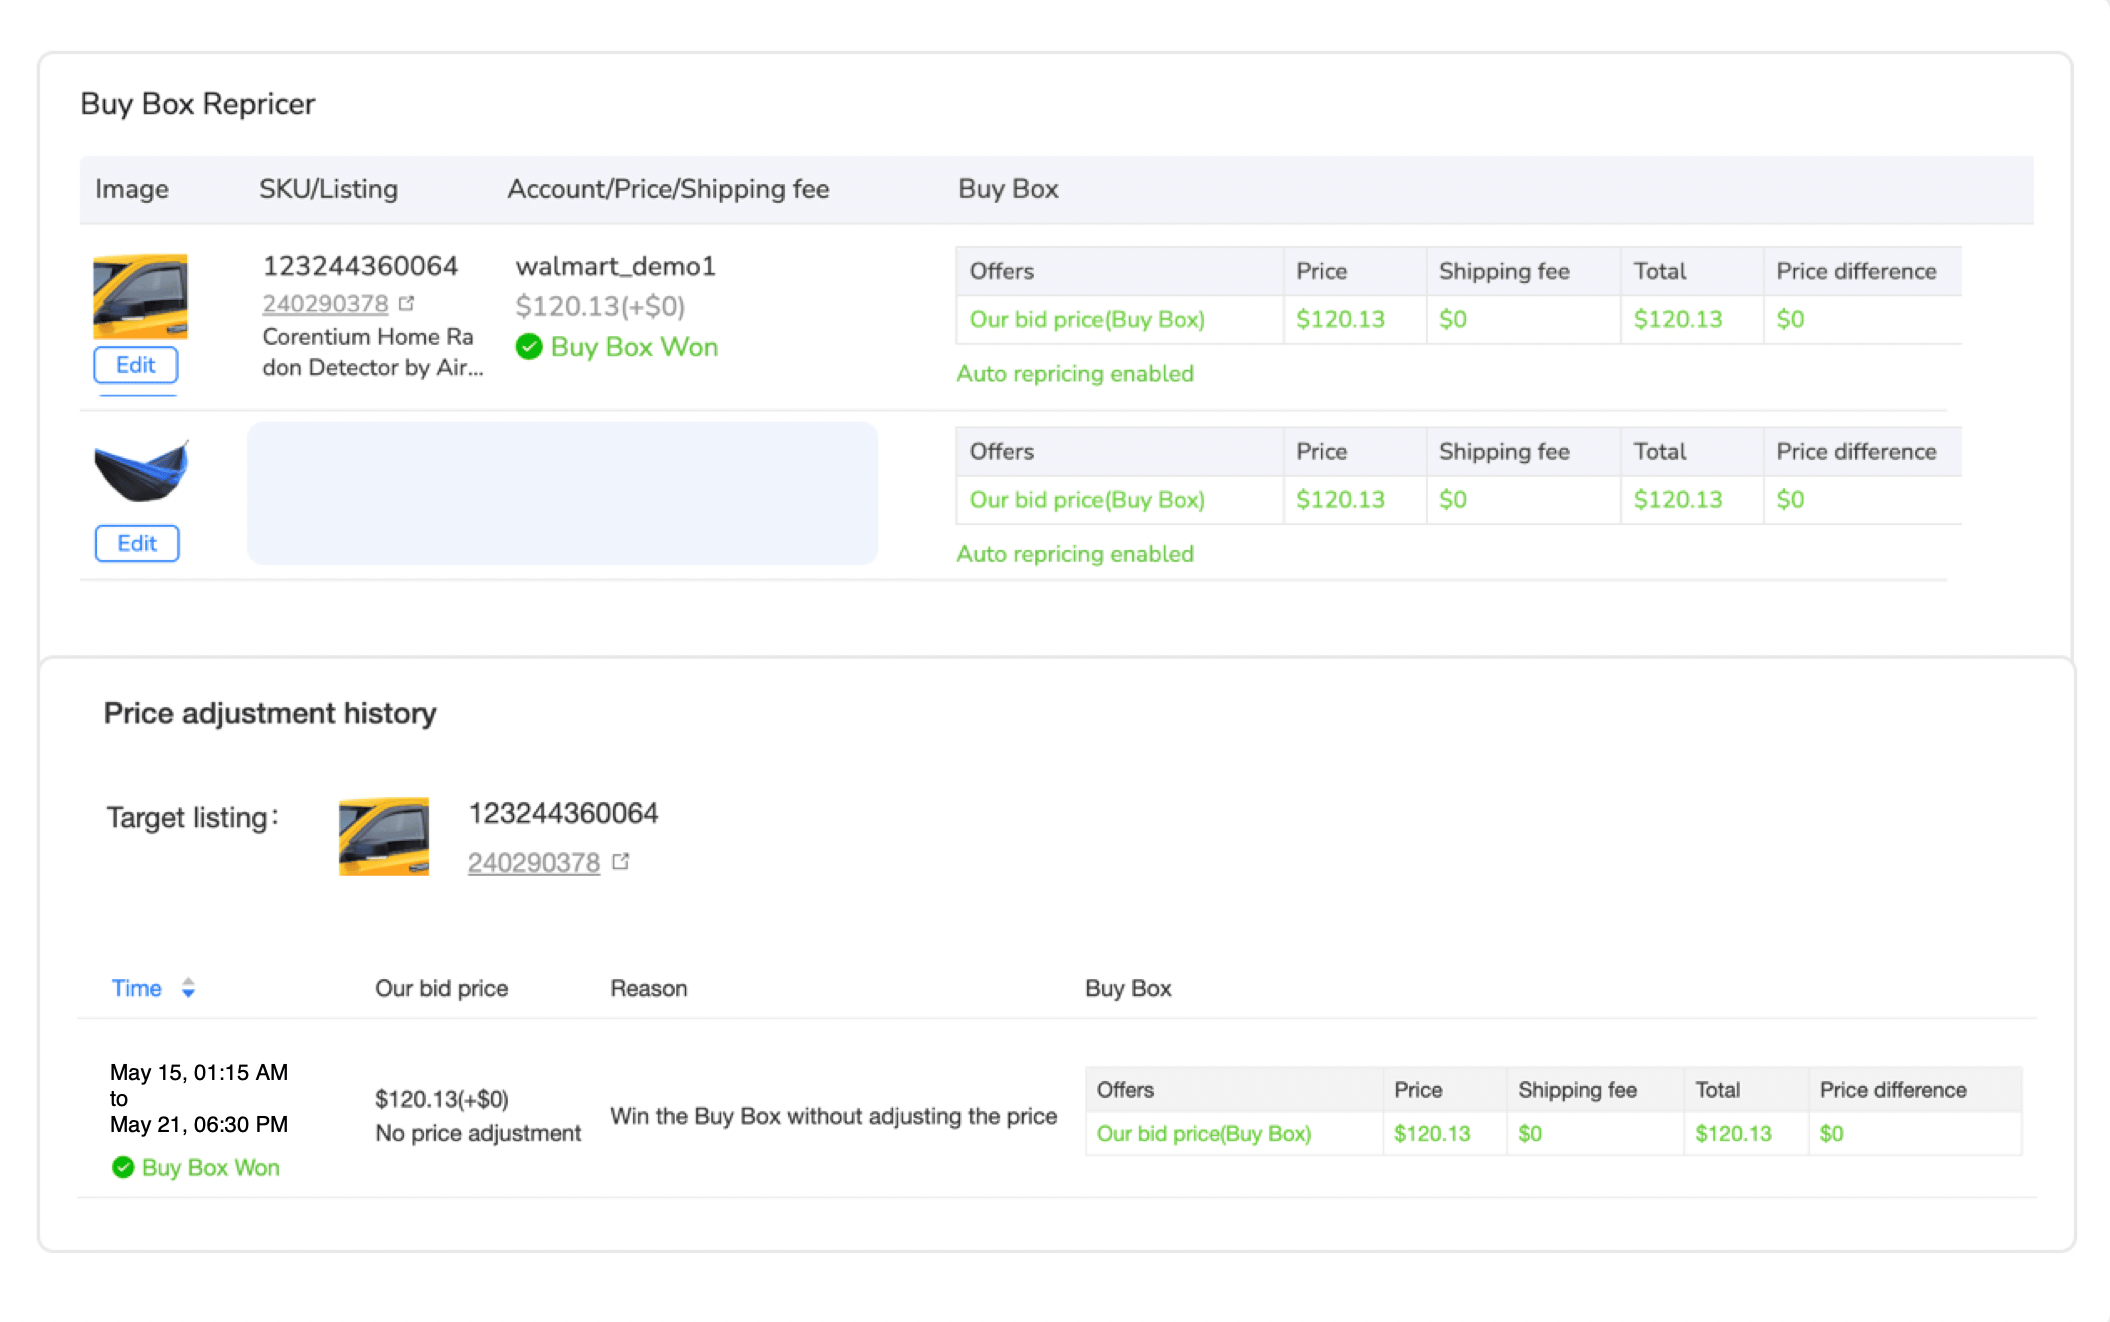
Here’s how Maxmerce’s Smart Buy Box Optimizer handles the same situation:
Step 1: Continuous Buy Box Monitoring
The system checks your Buy Box status every 5 minutes, 288 times daily, automatically tracking win rate percentages. You don’t manually check anything—the dashboard shows you’re currently winning 67% of the time, down from 85% yesterday. That triggers an alert.
Step 2: Automated Competitor Price Tracking
Maxmerce’s Competitor Tracking feature monitors all 8 competitors’ prices, inventory levels, and seller metrics simultaneously. Within seconds, you see Competitor C dropped their price from $15.99 to $14.49 six hours ago—a 9.4% cut. Their inventory shows 450 units, so this isn’t a liquidation; it’s a sustained competitive move.
Step 3: Margin Impact Analysis
The system instantly calculates your profitability at various price points. At $15.99 (your current price), you make $4.25 per unit with a 26.6% margin. Matching Competitor C at $14.49 drops you to $2.75 per unit and 18.9% margin. The tool shows you need to sell 35% more volume at $14.49 just to match your profit at $15.99. Is that volume lift realistic? Probably not.
Step 4: Intelligent Repricing Recommendation
Rather than blindly matching $14.49, Maxmerce’s Smart Buy Box Optimizer suggests dropping to $15.49—just 3.4% below your original price. Why? Historical data shows you typically win the Buy Box at prices within 5% of the lowest offer because your seller metrics (98% feedback, FBA fulfillment) are stronger than Competitor C’s (92% feedback, FBM). At $15.49, you make $3.75 per unit (23.5% margin) and reclaim 80%+ Buy Box ownership. That’s the sweet spot.
Step 5: Automated Price Adjustment
You approve the recommendation, and the system adjusts your price to $15.49 across Amazon, eBay, and Walmart simultaneously—no logging into three different seller portals. Within minutes, you’ve reclaimed the Buy Box on Amazon. The system continues monitoring, ready to adjust again if Competitor C responds.
The Time and Profit Math
Manually: 4-6 hours to notice the problem, research competitors, calculate margins, and adjust prices across channels. Lost sales during that window: approximately 12 units × $4.25 margin = $51 in lost profit. Final margin after panicked price matching: 18.9%.
With Maxmerce: 10 minutes to review the alert, approve the intelligent recommendation, and let automation execute. Lost sales during that window: approximately 1 unit × $4.25 = $4.25 in lost profit. Final margin after strategic repricing: 23.5%.
That’s $46.75 saved in immediate lost profit, plus 4.6 percentage points of higher margin going forward—which on 200 units monthly is an additional $184 in profit. Multiply that across 100+ products in your catalog, and you’re looking at $18,400 monthly margin improvement ($220,800 annually) simply by responding faster and smarter.
| Approach | Reaction Time | Data Quality | Margin Protection | Scalability |
|---|---|---|---|---|
| Manual Monitoring | 4-6 hours average delay | Incomplete snapshots | Panic pricing damages margins | Caps at ~50 products |
| Basic Repricers | 15-30 minutes | Price-only focus | Race-to-bottom algorithms | Scales but destroys profitability |
| Maxmerce Analytics | 5-10 minutes | Multi-dimensional intelligence | Margin-first repricing rules | Manages 1,000+ products efficiently |
Multi-Product Buy Box Intelligence
The real power emerges when you manage hundreds of products. Maxmerce’s Multi-Channel Dashboard provides portfolio-level insights impossible to achieve manually:
Buy Box Win Rate by Category: See that you’re winning 85% of Buy Boxes in Electronics but only 60% in Home & Garden. That tells you where to focus competitive improvement efforts or where to adjust pricing strategies category-wide.
Margin Erosion Alerts: Identify products where you’re winning the Buy Box but margins have compressed below 15% due to competitive pressure. These products need either cost negotiations with suppliers or strategic exits before they become unprofitable drains.
Opportunity Identification: Spot products where competitors have gone out of stock or raised prices, creating temporary windows to increase your prices 10-20% while maintaining Buy Box ownership. These “margin expansion events” can happen dozens of times monthly across a large catalog—but you’ll never see them without continuous monitoring.
Competitive Pattern Recognition: Machine learning algorithms identify competitor behaviors like “Seller X always undercuts you by exactly $0.50” or “Seller Y only competes on your top 20% of products by volume.” These insights inform product-specific repricing strategies that outsmart competitors rather than just react to them.
Beyond Price: Improving Non-Price Buy Box Factors
While price gets the most attention, improving non-price factors can let you win the Buy Box at 5-10% higher prices than competitors. Here’s how to systematically strengthen these often-overlooked dimensions.
Seller Performance Metrics: The Foundation
Your Order Defect Rate (ODR), Pre-Fulfillment Cancel Rate, and Late Shipment Rate aren’t just account health metrics—they’re direct Buy Box inputs. Here’s how to optimize each:
Order Defect Rate (Target: <0.5%)
ODR includes negative feedback, A-to-Z claims, and chargebacks. The official threshold is <1%, but top Buy Box winners maintain <0.5%. Every 0.1% improvement gives you algorithmic advantage over competitors at the 0.7-0.9% range. Focus on proactive customer service: respond to every message within 12 hours, offer solutions before customers escalate to A-to-Z claims, and aggressively pursue removal of unjustified negative feedback through Amazon’s appeal process.
Pre-Fulfillment Cancel Rate (Target: <1.5%)
Amazon penalizes sellers who cancel orders after confirming them. Most cancellations happen due to inventory sync failures across multiple channels—you sell the last unit on Amazon and eBay simultaneously, forcing a cancellation on one platform. The solution is real-time inventory synchronization across all channels. Tools that update inventory counts every 5-15 minutes prevent dual-selling scenarios that generate cancellations.
Late Shipment Rate (Target: <2% for FBM)
FBA sellers automatically have 0% late shipment rates since Amazon handles fulfillment. FBM sellers must ship on time or face Buy Box penalties. Build buffer time into your handling days—if you typically ship within 24 hours, set your handling time to 2 days in case of unexpected delays. Better to ship early than late; early ships boost metrics, late ships kill Buy Box eligibility.
Fulfillment Speed Optimization
If you’re not using FBA, your fulfillment speed needs to match or exceed it to compete for the Buy Box. Here’s the brutal math: FBA offers 2-day Prime shipping. If you’re FBM with 5-7 day shipping, you need to be 10-15% cheaper than FBA to win the Buy Box consistently. But at 10-15% lower prices, your margins are often non-existent.
The alternative is offering fast FBM shipping that rivals FBA:
2-Day Shipping for FBM: Partner with regional fulfillment centers or use services like ShipBob or Deliverr (now part of Shopify Fulfillment Network) that store inventory near major population centers. These services aren’t free—they charge $3-5 per order—but they let you compete for the Buy Box at prices only 3-5% below FBA instead of 10-15% below.
Same-Day Fulfillment: If you fulfill from your own warehouse, implement same-day shipping cutoffs (e.g., “orders by 3 PM ET ship today”). This doesn’t make your shipping faster (customers still receive in 3-5 days with standard shipping), but it improves perceived shipping speed and slightly boosts Buy Box eligibility versus competitors who ship next-day.
Upgrade to FBA for Winners: You don’t have to send all inventory to FBA—that ties up cash and incurs storage fees. Instead, identify your top 20% of products by sales volume (your Buy Box winners) and send only those to FBA. Fulfill your slower-moving 80% via FBM. This hybrid approach maximizes Buy Box wins on high-volume products while minimizing FBA costs on slow movers.
Inventory Depth Management
Amazon’s algorithm favors sellers who can fulfill consistent demand. If you regularly stockout, Amazon will increasingly assign the Buy Box to competitors even when you’re back in stock, because your reliability is questionable. Maintain inventory depth with these tactics:
Safety Stock Calculations: Never let FBA inventory drop below 30 days of supply based on trailing 60-day sales velocity. If you’re selling 90 units monthly, maintain minimum 90 units in FBA at all times. This buffer prevents stockouts during sales spikes or supply chain delays.
Restock Alerts: Configure automated alerts when inventory drops below your safety stock threshold. Maxmerce’s FBA/WFS Restock Alert feature monitors stock levels across Amazon FBA and Walmart WFS fulfillment centers, triggering notifications when you need to reorder. It factors in supplier lead times—if your supplier needs 30 days to deliver, you get alerts when stock drops to 60 days of supply, ensuring you reorder with time to spare.
Avoid Overstocking: While running out is bad, overstocking is also costly. Amazon charges long-term storage fees for inventory sitting 271+ days. Use sales velocity data to right-size inventory orders—enough to prevent stockouts, not so much you incur unnecessary storage fees. For seasonal products, this is especially critical: send enough inventory to cover the season, but not so much you’re paying storage fees for 9 months of slow sales.
Customer Feedback Optimization
Your overall seller feedback percentage impacts Buy Box eligibility, though less than seller performance metrics. Still, moving from 92% to 96% positive feedback gives you a small algorithmic edge. Here’s how to systematically improve feedback:
Proactive Feedback Requests: Send feedback request emails 3-5 days after delivery (when customers have received and used the product but haven’t yet forgotten about it). Personalize requests with product names and order details. Don’t ask for “5-star reviews”—that violates Amazon TOS. Instead, request honest feedback and make it easy with direct links to the feedback page.
Negative Feedback Mitigation: When you receive negative feedback, respond publicly within 24 hours acknowledging the issue and offering a resolution. Then contact the customer privately offering a replacement, refund, or solution. Once resolved, politely request feedback revision. Amazon’s data shows 40-50% of customers revise negative feedback to neutral or positive when sellers proactively resolve issues.
Feedback Removal Requests: Amazon removes feedback that violates policies—profanity, personal information, or comments about products (not seller service). Review every piece of negative feedback for removal eligibility. Even one removal can shift your 94% rating to 95%, which over time influences Buy Box eligibility.
Optimize Every Buy Box Factor Simultaneously
Maxmerce Analytics tracks price, inventory, seller metrics, and competitor intelligence in one unified platform—eliminating the need for manual monitoring across multiple dimensions.
Multi-Channel Buy Box Strategy: Amazon, eBay, Walmart
US and European sellers don’t compete on Amazon alone. eBay’s “Top Rated Plus” and Walmart’s “Buy Box” use similar (but not identical) algorithms. Smart sellers optimize across all three channels simultaneously, avoiding the trap of winning Amazon’s Buy Box while losing eBay and Walmart to competitors.
eBay’s Best Match and Top Rated Plus
eBay doesn’t have a traditional “Buy Box” for non-branded items. Instead, it uses “Best Match” ranking in search results. For branded items where multiple sellers offer the same product, eBay displays a simplified listing page similar to Amazon’s Buy Box, highlighting one seller’s offer prominently.
eBay’s algorithm weighs factors differently than Amazon:
- Price + Shipping Total (40-45%): eBay evaluates total cost, not just item price. A $25 item with free shipping ranks higher than a $24 item with $3 shipping. Always offer free shipping on eBay and absorb costs into your item price.
- Top Rated Seller Status (25-30%): Achieving TRS (Top Rated Seller) status gives massive algorithmic preference. Requirements: 100+ transactions and $1,000+ sales in 12 months, <0.5% transaction defects, <0.3% cases closed without seller resolution, 14-day returns, and 1-day handling time.
- Fast ‘N Free (15-20%): eBay’s Fast ‘N Free badge (free 4-day shipping or faster) boosts visibility significantly. Combine with TRS for maximum algorithmic advantage.
- Seller Performance (10-15%): Defect rate, late shipments, and cases impact ranking. Same principles as Amazon—keep defects <0.5% and ship on time 99%+ of the time.
The eBay repricing strategy differs from Amazon: focus on total landed cost (price + shipping), not just item price. If competitors offer $25 with $5 shipping ($30 total), you beat them at $29 with free shipping, even though your item price is higher.
Walmart’s Buy Box Algorithm
Walmart’s Buy Box algorithm is the youngest and least mature of the three platforms, but it’s rapidly evolving. As of March 2025, Walmart weighs these factors:
- Walmart Fulfillment Services (WFS) Preference (35-40%): WFS gets huge algorithmic preference, similar to Amazon’s FBA advantage. WFS offers 2-day shipping and the coveted “Free Shipping” badge. Non-WFS sellers can win, but need to be 8-12% cheaper than WFS offers.
- Price Competitiveness (30-35%): Walmart is the most price-sensitive platform—customers shop Walmart expecting low prices. Being the lowest price matters more on Walmart than Amazon or eBay. However, you still don’t need to be cheapest; within 2-3% of lowest while having better seller metrics can win.
- On-Time Delivery Rate (15-20%): Walmart penalizes late deliveries more harshly than Amazon. Target 98%+ on-time delivery. WFS handles this automatically; FBM sellers need robust logistics.
- Order Defect Rate (10-15%): Similar to Amazon—keep cancellations, returns, and refunds <1.5%. Walmart calculates this slightly differently (returns count more heavily), so focus on accurate product descriptions to minimize return rates.
Walmart’s opportunity: it’s still less competitive than Amazon. Many Amazon sellers haven’t expanded to Walmart, meaning Buy Box competition is lighter. You can often win Walmart’s Buy Box at 5-10% higher prices than you’d need for Amazon’s Buy Box on the same product.
Unified Multi-Channel Repricing
Managing three different repricing strategies across Amazon, eBay, and Walmart manually is impossible. You’d need to check each platform separately, apply different pricing logic, and adjust constantly. This is where unified multi-channel tools transform operations.
Maxmerce’s Multi-Channel Dashboard applies platform-specific repricing rules automatically:
Platform-Aware Pricing: Set your target margin once (e.g., 25%), and the system calculates platform-specific prices accounting for different fee structures. Amazon FBA fees are 15% on a $30 item. eBay fees are 12.9% + $0.30. Walmart fees are 15%. To achieve the same 25% net margin, your prices need to differ slightly across platforms. Maxmerce’s system handles this math automatically, ensuring consistent profitability across channels.
Competitive Intelligence by Channel: The same product has different competitors on Amazon, eBay, and Walmart. Maxmerce’s Competitor Tracking monitors all three independently. On Amazon, you might face 12 competitors. On Walmart, only 3. That informs different repricing aggressiveness—compete hard on Amazon where competition is fierce, but maintain higher prices on Walmart where you have less competition.
Inventory Sync Prevents Overselling: Sell the same product on all three platforms and you risk overselling—selling the last unit on Amazon and eBay simultaneously, forcing a cancellation that damages seller metrics. Maxmerce’s inventory sync updates stock levels across all channels in real-time (every 5 minutes). When you sell a unit on Amazon, eBay and Walmart inventory automatically decrements, preventing dual-sells and the resulting cancellations.
Unified Performance Monitoring: Track Buy Box win rates, sales velocity, and margin performance across all three channels in one dashboard. See that you’re winning 85% of Amazon Buy Boxes but only 60% on eBay. That signals you need to adjust eBay pricing or improve seller metrics (maybe add 14-day returns to qualify for TRS). Without unified monitoring, you’d never spot this channel-specific underperformance.
The time savings are substantial: managing repricing manually across 200 products on three channels requires checking 600 product-channel combinations. At 2 minutes each, that’s 1,200 minutes (20 hours) daily—obviously impossible. Automated multi-channel repricing reduces that to 15-30 minutes daily reviewing automated adjustments and approving strategic decisions flagged for manual review.
Common Buy Box Mistakes That Cost You Sales
Even experienced sellers make Buy Box optimization mistakes that silently drain sales and margins. Here are the most common errors and how to avoid them.
Mistake 1: Racing to the Absolute Lowest Price
The myth: “Lowest price always wins the Buy Box.”
The reality: Competitive price combined with good seller metrics beats absolute lowest price with poor metrics.
Sellers obsessed with being cheapest destroy their margins chasing a myth. You don’t need to be lowest; you need to be competitive (within 3-5%) while maintaining strong seller performance. Test this yourself: check products you sell. Often, the Buy Box holder isn’t the cheapest offer—they’re 2-4% higher than the lowest offer but have FBA, 98% feedback, and excellent metrics.
The fix: Set a competitive floor (minimum profitable price) and refuse to go below it. If winning the Buy Box requires dropping below your floor, let the Buy Box go. Your offer still appears in “Other Sellers” and captures some sales, and you maintain margins. Competitors selling at unsustainable prices will raise them or exit eventually.
Mistake 2: Ignoring Buy Box Win Rate Metrics
Many sellers check whether they have the Buy Box right now, but never track what percentage of time they win it. This is like checking your bank balance but never tracking income versus expenses—you’re missing the trend.
Buy Box ownership fluctuates constantly. You might have it when you check at 10 AM but lose it at 2 PM when a competitor adjusts. Without tracking win rate percentage over time, you can’t assess whether your strategy is working.
The fix: Track Buy Box win rate as a key performance indicator. Aim for 80-85%+ on your core products. If you’re below 70%, either adjust pricing or accept lower sales volume at higher margins. If you’re above 90%, test higher prices—you’re leaving margin on the table.
Mistake 3: Treating All Products the Same
Not all products deserve the same repricing aggressiveness. Your best-selling product generating 30% of revenue deserves aggressive Buy Box competition—even accepting slightly lower margins to maintain volume. Your slowest seller generating <1% of revenue? Don’t waste time or margin competing hard for that Buy Box.
The fix: Segment products into tiers based on sales volume or profitability:
- Tier 1 (Top 20% by revenue): Compete aggressively, accept competitive floors 15% above cost, monitor constantly
- Tier 2 (Middle 30% by revenue): Compete moderately, set competitive floors 20% above cost, monitor daily
- Tier 3 (Bottom 50% by revenue): Compete minimally, set competitive floors 25%+ above cost, accept lower win rates
This tiered approach focuses your energy where it matters most—protecting volume and margins on your winners while not obsessing over low-impact products.
Mistake 4: Forgetting About Landed Cost
Sellers often set prices based on product cost alone, forgetting to factor in all fulfillment fees, return costs, and advertising expenses. This leads to “profitable on paper, unprofitable in reality” scenarios.
Calculate true landed cost: Product Cost + Inbound Shipping + FBA Fees + Estimated Return Rate (typically 5-10%) + Advertising Cost per Unit. For a $20 product with $6 FBA fees, $1 inbound shipping, 8% return rate ($1.68), and $2 advertising cost per unit, your true landed cost is $30.68. Selling at $32 gives you only 4.3% margin—barely enough to justify the business risk.
The fix: Use tools like Maxmerce’s Profit Analyzer that calculate true profitability factoring in all fees, returns, and advertising costs automatically. Set your competitive floors based on true landed cost, not just product cost. This prevents accidentally selling at a loss while thinking you’re profitable.
Mistake 5: Neglecting Seasonal Repricing Adjustments
Buy Box competition intensity varies dramatically by season. Q4 (October-December) sees maximum competition as sellers fight for holiday sales. Q1 (January-March) sees reduced competition as many sellers run out of inventory or capital.
Using the same repricing strategy year-round misses opportunities. In Q1, you can often raise prices 5-10% and maintain Buy Box ownership because competition is lighter. In Q4, you need more aggressive pricing to compete with the flood of sellers.
The fix: Adjust your competitive floors seasonally. Set looser floors (lower prices) in Q4 to maintain volume during peak season, accepting slightly lower margins. Tighten floors (higher prices) in Q1-Q2 to maximize margin during low-competition periods. Review and adjust quarterly, not just “set it and forget it.”
Advanced Buy Box Tactics for Competitive Markets
When you’re in highly competitive markets with 15+ sellers, basic repricing strategies aren’t enough. Here are advanced tactics that separate sophisticated sellers from the rest.
The Loss-Leader Buy Box Strategy
Intentionally take lower margins on high-visibility products to drive overall account performance, then capture profits on complementary products.
Example: You sell phone cases and screen protectors. Phone cases are commoditized with 20 competitors—it’s nearly impossible to maintain 25% margins and win the Buy Box consistently. Screen protectors have only 5 competitors.
The strategy: Compete aggressively on phone cases, accepting 10-12% margins to win the Buy Box 85%+ of the time. Use phone case sales to drive reviews and seller feedback, improving your account metrics. Then, leverage those strong metrics to win screen protector Buy Boxes at 30%+ margins. Your blended margin across both products hits your 25% target, even though you’re sacrificing margin on one category to boost the other.
This works because Amazon evaluates seller performance holistically. High sales volume on phone cases (even at low margins) generates positive feedback and order defect rate improvements that boost your Buy Box eligibility across all products, including higher-margin screen protectors.
The Inventory-Out Strategy
Monitor competitors’ inventory levels and time your price increases for when they’re about to run out of stock.
When your main competitor has 500 units, they’ll compete consistently. When they’re down to 20 units, they’re 3-5 days from stockout. That’s your window to raise prices.
Raise your price 5-10% when you see competitors’ inventory dropping below 30 units. Worst case, they have enough inventory to maintain the Buy Box for another week, and you sacrifice some Buy Box percentage temporarily. Best case, they stockout within days, and you capture the Buy Box at higher prices until they restock—often 2-3 weeks later. During that window, you’ve made 5-10% higher margins on every sale.
This requires competitor inventory monitoring—something manual processes can’t scale. Tools like Maxmerce’s Competitor Tracking monitor inventory levels across all competitors, alerting you when stockout windows open.
The Geographic Fulfillment Advantage
Amazon assigns the Buy Box partly based on fulfillment speed, which varies by customer location. A seller with inventory in Amazon’s California fulfillment center has an advantage for West Coast customers, while a seller with inventory in Pennsylvania has an advantage for East Coast customers.
If you’re selling high-volume products (500+ units monthly), consider splitting inventory across multiple Amazon fulfillment centers using Amazon’s distributed inventory placement. This gives you a slight algorithmic advantage across all US regions rather than being strongest in one region.
The trade-off: distributed inventory placement increases inbound shipping costs (you’re shipping to 2-3 fulfillment centers instead of 1). But for high-margin products where Buy Box win rate directly impacts profitability, the 2-3% higher Buy Box ownership can justify the extra fulfillment costs.
The Review Velocity Strategy
While review count isn’t a direct Buy Box factor, review velocity (how quickly you’re generating new reviews) correlates with sales velocity, which Amazon does consider. Products generating 5-10 new reviews monthly signal strong sales momentum, indirectly boosting Buy Box eligibility.
Implement aggressive (but policy-compliant) review generation strategies:
- Amazon Vine Program: Enroll new products in Vine to generate 15-30 early reviews quickly
- Automated Review Requests: Use Amazon’s “Request a Review” button API to automatically request reviews 5-7 days post-delivery
- Insert Cards: Include product insert cards encouraging reviews (without incentivizing positive reviews, which violates TOS)
Products with strong review velocity (10+ new reviews monthly) tend to win Buy Boxes more frequently than products with stagnant review counts, even at slightly higher prices. Amazon interprets review velocity as a quality and popularity signal.
Ready to Master Buy Box Optimization?
Maxmerce’s Analytics module combines Buy Box monitoring, competitor tracking, and margin-protected repricing into one intelligent system designed for US and European sellers scaling on Amazon, eBay, and Walmart.
Measuring Buy Box Performance: KPIs That Matter
You can’t improve what you don’t measure. Here are the five critical Buy Box KPIs to track weekly, with target benchmarks for healthy performance.
1. Buy Box Win Rate (%)
Definition: Percentage of time you own the Buy Box over a given period (daily, weekly, monthly).
Target: 80-85% for core products, 60-70% for highly competitive products, 90%+ for products with few competitors.
Why It Matters: Win rate directly correlates with sales volume. An 80% win rate means you’re capturing 80% of potential sales; 20% are going to competitors.
How to Improve: If below target, either adjust pricing (2-3% lower) or improve seller metrics (faster shipping, better ODR). If above 90%, test higher prices—you’re likely leaving margin on the table.
2. Average Buy Box Price vs. Your Price (Spread)
Definition: The percentage difference between the Buy Box price and your current price.
Target: Within +/-3% of Buy Box price for products you want to win.
Why It Matters: Large spreads indicate you’re either significantly overpriced (losing Buy Box) or underpriced (leaving margin on the table).
How to Improve: If you’re 10% above Buy Box price, you’re not competitive—lower prices or accept reduced sales. If you’re 5% below Buy Box price, raise prices incrementally until you’re within 2-3% while maintaining Buy Box wins.
3. Margin Percentage at Buy Box Price
Definition: Your profit margin when selling at the current Buy Box price.
Target: Minimum 15% on competitive products, 25%+ on less competitive products.
Why It Matters: Winning the Buy Box at 8% margins isn’t sustainable. You need healthy margins to survive advertising costs, returns, and operational expenses.
How to Improve: If margins are below 15%, either negotiate better supplier pricing, improve operational efficiency, or exit the product. Don’t compete long-term at unsustainable margins hoping things will improve—they won’t.
4. Competitor Count (Active Sellers)
Definition: Number of sellers actively competing for the Buy Box on your products.
Target: <5 competitors for comfortable margins, 5-10 for moderate competition, 10+ requires advanced repricing.
Why It Matters: More competitors = lower prices = compressed margins. Track competitor count trends—if it’s rising from 5 to 12 over 3 months, margin pressure is increasing and you need strategy adjustments.
How to Improve: You can’t directly reduce competition, but you can choose products with lower competitor counts when sourcing new inventory. Also, track competitor exits (sellers dropping out)—that’s your signal to raise prices.
5. Sales Conversion Rate (%)
Definition: Percentage of page views that convert to sales.
Target: 10-15% for Buy Box holders, <3% for non-Buy Box holders.
Why It Matters: Conversion rate measures how effectively you’re monetizing traffic. Winning the Buy Box boosts conversion dramatically—from ~2% (non-Buy Box) to ~12% (Buy Box holder).
How to Improve: If you own the Buy Box but conversion is <8%, your product page needs work (better images, more detailed bullets, A+ Content, answered questions). If conversion drops when you have the Buy Box, competitor may have won it with better listing quality.
Frequently Asked Questions: Amazon Buy Box Optimization
Conclusion: Win the Buy Box Without Sacrificing Profitability
Amazon’s Buy Box represents 82% of sales, making it the single most valuable real estate in e-commerce. But winning it doesn’t require racing to the bottom or destroying margins. Smart sellers combine competitive pricing with strong seller metrics, fast fulfillment, and real-time competitive intelligence to maintain 80-85% Buy Box ownership at 20-30% profit margins.
The key insights that separate winners from losers:
Price is only 35-40% of the algorithm. Invest equal energy improving seller metrics, fulfillment speed, and inventory depth. These non-price factors let you win at higher prices than pure price competition allows.
Manual monitoring fails at scale. With competitors repricing every 15-30 minutes and Buy Box recalculations happening constantly, human monitoring can’t compete. Automation isn’t optional—it’s foundational for sustained success.
Margin protection is non-negotiable. Set minimum profitable prices (competitive floors) and refuse to compete below them. Losing the Buy Box temporarily while maintaining margins is infinitely better than winning it while selling at a loss.
Competitive intelligence beats blind repricing. Understanding competitor patterns (who’s aggressive, who’s stable, who’s inventory-constrained) informs smarter strategies than simply reacting to current prices.
Multi-channel optimization multiplies results. US sellers competing on Amazon, eBay, and Walmart can’t optimize each channel in isolation. Unified repricing, inventory sync, and performance monitoring across platforms prevents overselling while maximizing channel-specific Buy Box wins.
For sellers managing 100+ products across multiple channels, the complexity quickly becomes overwhelming. That’s exactly why tools like Maxmerce’s Analytics module exist—to automate the monitoring, provide the intelligence, and protect the margins that manual processes simply can’t achieve at scale.
The e-commerce sellers winning today aren’t those with the lowest prices or the most products. They’re the ones with the smartest systems—combining real-time data, intelligent automation, and margin discipline to win Buy Boxes profitably while competitors burn out in unsustainable price wars.
Your move: implement these amazon buy box optimization tactics, track the KPIs that matter, and build the systems that scale. The Buy Box is winnable at healthy margins—if you’re strategic, data-driven, and disciplined in execution.